OPEN-SOURCE SCRIPT
Telah dikemas kini Ultimate Oscillator + Realtime Divergences
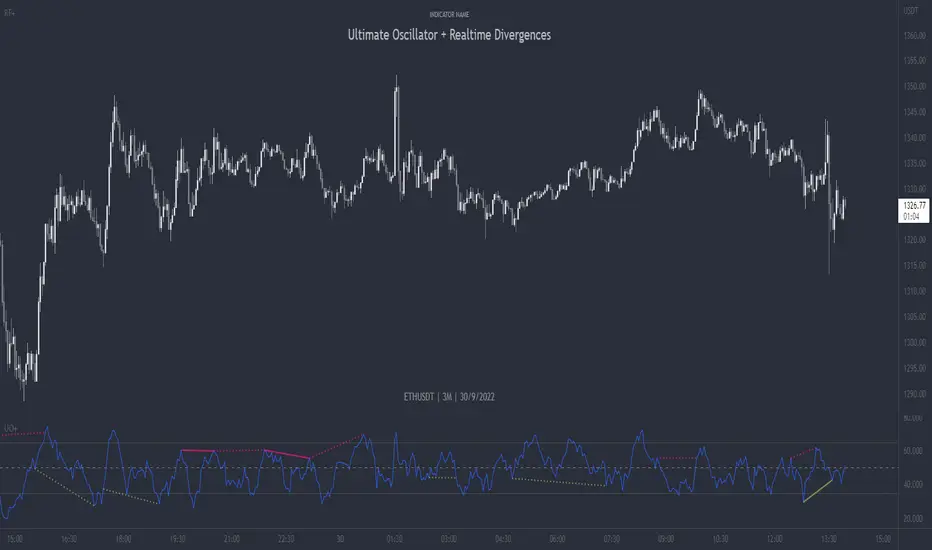
Ultimate Oscillator (UO) + Realtime Divergences + Alerts + Lookback periods.
This version of the Ultimate Oscillator adds the following 5 additional features to the stock UO by Tradingview:
- Optional divergence lines drawn directly onto the oscillator in realtime
- Configurable alerts to notify you when divergences occur, as well as centerline crossovers.
- Configurable lookback periods to fine tune the divergences drawn in order to suit different trading styles and timeframes.
- Background colouring option to indicate when the UO has crossed the centerline, or optionally when both the UO and an external oscillator, which can be linked via the settings, have both crossed their centerlines.
- Alternate timeframe feature allows you to configure the oscillator to use data from a different timeframe than the chart it is loaded on.
This indicator adds additional features onto the stock Ultimate Oscillator by Tradingview, whose core calculations remain unchanged. Namely the configurable option to automatically and clearly draw divergence lines onto the oscillator for you as they occur in realtime. It also has the addition of unique alerts, so you can be notified as divergences occur without spending all day watching the charts. Furthermore, this version of the Ultimate Oscillator comes with configurable lookback periods, which can be configured in order to adjust the length of the divergences, in order to suit shorter or higher timeframe trading approaches.
The Ultimate Oscillator
Tradingview describes the Ultimate Oscillator as follows:
“The Ultimate Oscillator indicator (UO) indicator is a technical analysis tool used to measure momentum across three varying timeframes. The problem with many momentum oscillators is that after a rapid advance or decline in price, they can form false divergence trading signals. For example, after a rapid rise in price, a bearish divergence signal may present itself, however price continues to rise. The ultimate Oscillator attempts to correct this by using multiple timeframes in its calculation as opposed to just one timeframe which is what is used in most other momentum oscillators.”
More information on the history, use cases and calculations of the Ultimate Oscillator can be found here: tradingview.com/scripts/ulti...
What are divergences?
Divergence is when the price of an asset is moving in the opposite direction of a technical indicator, such as an oscillator, or is moving contrary to other data. Divergence warns that the current price trend may be weakening, and in some cases may lead to the price changing direction.
There are 4 main types of divergence, which are split into 2 categories;
regular divergences and hidden divergences. Regular divergences indicate possible trend reversals, and hidden divergences indicate possible trend continuation.
Regular bullish divergence: An indication of a potential trend reversal, from the current downtrend, to an uptrend.
Regular bearish divergence: An indication of a potential trend reversal, from the current uptrend, to a downtrend.
Hidden bullish divergence: An indication of a potential uptrend continuation.
Hidden bearish divergence: An indication of a potential downtrend continuation.
Setting alerts.
With this indicator you can set alerts to notify you when any/all of the above types of divergences occur, on any chart timeframe you choose.
Configurable lookback values.
You can adjust the default lookback values to suit your prefered trading style and timeframe. If you like to trade a shorter time frame, lowering the default lookback values will make the divergences drawn more sensitive to short term price action.
How do traders use divergences in their trading?
A divergence is considered a leading indicator in technical analysis , meaning it has the ability to indicate a potential price move in the short term future.
Hidden bullish and hidden bearish divergences, which indicate a potential continuation of the current trend are sometimes considered a good place for traders to begin, since trend continuation occurs more frequently than reversals, or trend changes.
When trading regular bullish divergences and regular bearish divergences, which are indications of a trend reversal, the probability of it doing so may increase when these occur at a strong support or resistance level . A common mistake new traders make is to get into a regular divergence trade too early, assuming it will immediately reverse, but these can continue to form for some time before the trend eventually changes, by using forms of support or resistance as an added confluence, such as when price reaches a moving average, the success rate when trading these patterns may increase.
Typically, traders will manually draw lines across the swing highs and swing lows of both the price chart and the oscillator to see whether they appear to present a divergence, this indicator will draw them for you, quickly and clearly, and can notify you when they occur.
Disclaimer: This script includes code from the stock UO by Tradingview as well as the Divergence for Many Indicators v4 by LonesomeTheBlue.
Nota Keluaran
- Increased the default pivot period which influences the form of the divergences drawn, with the aim of identifying more useful divergences.
- Added configurable settings to automatically adjust the pivot period when loaded on up to 4 different chart timeframes to better suit those timeframes, by default it is set to automatically adjust the pivot period on 5min, 15min, 1hr and 4hr charts.
- Disabled the background colour that indicates where the oscillator crosses over the centerline by default.
- Changed the colour of the oscilliator line to blue, as per the stock UO, to suit more background colours and maintain familiarity with the stock UO.
- Changed the shorttitle to 'UO+'
Nota Keluaran
- Updated the screenshot to reflect the colour change of the UO line
Nota Keluaran
- Added full indicator name, symbol info and timeframe to chart to comply with house rules.- Presented on a naked chart to comply with house rules
- Trimmed whitespace at end of file
Nota Keluaran
- Updated the screenshot to make the chart more legibleNota Keluaran
- Updated the chart image to show Japanese Candles instead of Heikin Ashi to comply with Tradingview rules.Nota Keluaran
- Disabled the range bands by default- Altered the styling of the centerline to use dotted line instead of dashed line by default.
Nota Keluaran
- Reorganised the settings menu.- Added additional styling options to the oscillator into the main options tab of the menu settings.
- Added an option to enable the use of Heikin Ashi Open and Close values on a non-Heikin Ashi chart, for a smoother, less volatile oscillator.
- Increased the default oscillator line width to use linewidth 2, consistent with the factory UO provided by Tradingview.
Nota Keluaran
- Removed unused setting from settings menuNota Keluaran
- Refactored settings menuNota Keluaran
- Corrected the Select Alterntive Timeframe code- Set oscillator to present with 'barmerge.gaps_on' option for a smoother line for when using a higher timeframe than the current chart timeframe.
Nota Keluaran
- Updated the divergence drawing code to use Heikin Ashi OHLC values when Heikin Ashi mode is enabledNota Keluaran
- Added a fade out feature into the settings for the crossover dots and the oscillator itself, which optionally fades out all but the most recent section of the oscillator to reduce visual noise on the chart.Nota Keluaran
- Added a 'Flip oscillator' feature into the settings for use with the Tradingview 'Flip chart' (Alt+i) feature, so both the chart and the oscillators can be flipped upside down to help see the opposite scenario for traders who have too one-sided a bias.Nota Keluaran
- Added a 'flipped' warning label to the oscillator panel to show when the osc is flipped.Nota Keluaran
- Readded the 'Alt centerline' color option as it had stopped appearing from the styles tab, moved it into the styles section of the inputs tab instead.Nota Keluaran
- Removed the unused source input option from pivot period settings.Nota Keluaran
- Updated alerts so they only trigger once per divergence instance, and not if the following bar reprints the same divergence.- Added alert that will alert any type of alert in a single alert.
- Removed the centerline crossover alerts.
Nota Keluaran
- Reorganised settings dialog.- Added custom line colour option.
- Removed the auto-adjust pivot period based on selected chart timeframe.
Nota Keluaran
- Refactored, regrouped settings and default colours for the background and crossunder related features.Nota Keluaran
- Added an option for Heikin Ashi charts, setting for range bands "Heikin Ashi range band levels", which will adjust the oversold and overbought band levels from 30 and 70, to 35 and 65, this will also increase the height of the oscillator in the panel. Disabled by default.Nota Keluaran
- Minor adjustment to previous change re positioning and showing/hiding range bands.Nota Keluaran
- Fixed the background positioning inline with recent change to range band levels.Nota Keluaran
- Added option to customise the colour of the overbought and oversold sections on the oscillatorSkrip sumber terbuka
Dalam semangat TradingView sebenar, pencipta skrip ini telah menjadikannya sumber terbuka, jadi pedagang boleh menilai dan mengesahkan kefungsiannya. Terima kasih kepada penulis! Walaupuan anda boleh menggunakan secara percuma, ingat bahawa penerbitan semula kod ini tertakluk kepada Peraturan Dalaman.
Penafian
Maklumat dan penerbitan adalah tidak bertujuan, dan tidak membentuk, nasihat atau cadangan kewangan, pelaburan, dagangan atau jenis lain yang diberikan atau disahkan oleh TradingView. Baca lebih dalam Terma Penggunaan.
Skrip sumber terbuka
Dalam semangat TradingView sebenar, pencipta skrip ini telah menjadikannya sumber terbuka, jadi pedagang boleh menilai dan mengesahkan kefungsiannya. Terima kasih kepada penulis! Walaupuan anda boleh menggunakan secara percuma, ingat bahawa penerbitan semula kod ini tertakluk kepada Peraturan Dalaman.
Penafian
Maklumat dan penerbitan adalah tidak bertujuan, dan tidak membentuk, nasihat atau cadangan kewangan, pelaburan, dagangan atau jenis lain yang diberikan atau disahkan oleh TradingView. Baca lebih dalam Terma Penggunaan.