OPEN-SOURCE SCRIPT
Stock Comparison to S&P 500
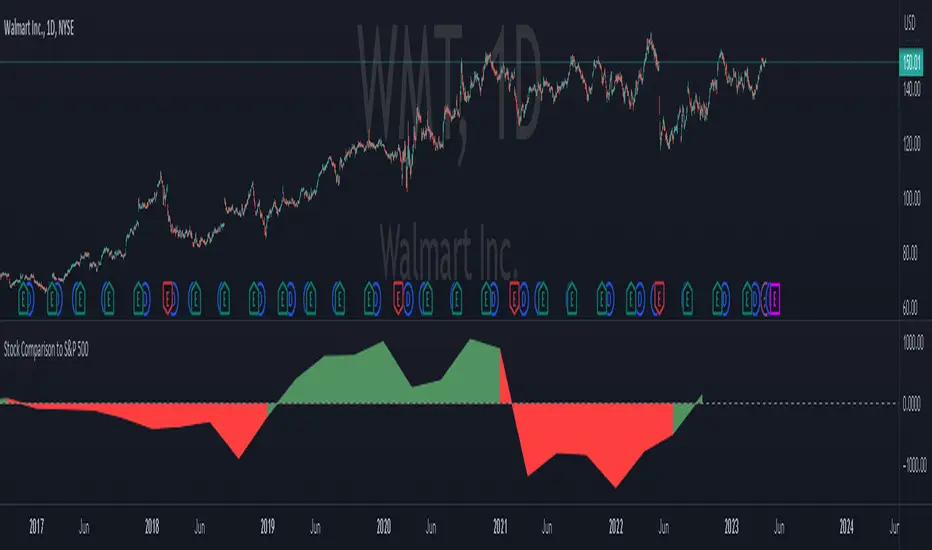
This indicator, "Stock Comparison to S&P 500," is designed to help traders compare the financial health and valuation of a chosen stock to the S&P 500 index. It compares several key financial metrics of the stock to the corresponding metrics of the S&P 500, including earnings growth, price-to-earnings ratio, price-to-book ratio, and price-to-sales ratio.
The indicator calculates the differences between each metric of the selected stock and the S&P 500, and then weights them using a formula that takes into account the importance of each metric. The resulting value represents the overall comparison between the stock and the S&P 500.
The indicator also displays the differences between the individual metrics in separate plots, allowing traders to see how each metric contributes to the overall comparison. Additionally, it colors the plots green if the selected stock is performing better than the S&P 500 in a particular metric and red if it's performing worse.
Traders can use this indicator to gain insight into the relative financial health and valuation of a selected stock compared to the S&P 500 index, which can help inform their trading decisions.
Skrip sumber terbuka
Dalam semangat sebenar TradingView, pencipta skrip ini telah menjadikannya sumber terbuka supaya pedagang dapat menilai dan mengesahkan kefungsiannya. Terima kasih kepada penulis! Walaupun anda boleh menggunakannya secara percuma, ingat bahawa menerbitkan semula kod ini adalah tertakluk kepada Peraturan Dalaman kami.
Penafian
Maklumat dan penerbitan adalah tidak dimaksudkan untuk menjadi, dan tidak membentuk, nasihat untuk kewangan, pelaburan, perdagangan dan jenis-jenis lain atau cadangan yang dibekalkan atau disahkan oleh TradingView. Baca dengan lebih lanjut di Terma Penggunaan.