OPEN-SOURCE SCRIPT
Telah dikemas kini Detrended Price Oscillator with projected SMA
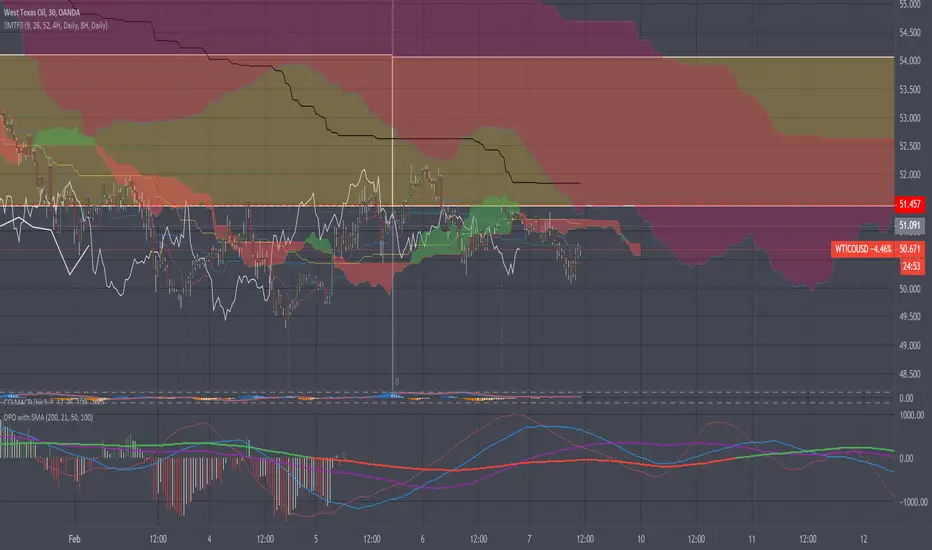
Haven't seen any DPO scripts like this one...
Dpo is generaly use to find cycles in the market rather than prices trends.
As you can see a centralized Dpo is ploted with barsback *actual is shown behing actual price timeline.
Using timeline diferences between the two last highest or the two last lowest histogram bands can give you an aproximation of those market cycles.
Dpo SMA's trends can also be use to compare actual price timeline direction in 3 ways...
#-1: Is the actual price (candles) trend is against or with the dpo SMA's (convergence;divergence) ?
#-2: Is the actual price trend is condensed or dispersed ( criticals values)?
#-3: Does the dpo SMA's are near or far from the dpo cycle bottoms or cycle tops ?
Make sure to know that this indicator isn't a trading reccomandation and may not be suited for your trading style as well that it can be badly interpreted. USE WITH CAUTIONS !
//----Coder----//
R.V.
//----Thanx----//
Nota Keluaran
AutoSMA above or below 0 color changeSkrip sumber terbuka
Dalam semangat TradingView sebenar, pencipta skrip ini telah menjadikannya sumber terbuka, jadi pedagang boleh menilai dan mengesahkan kefungsiannya. Terima kasih kepada penulis! Walaupuan anda boleh menggunakan secara percuma, ingat bahawa penerbitan semula kod ini tertakluk kepada Peraturan Dalaman.
Penafian
Maklumat dan penerbitan adalah tidak bertujuan, dan tidak membentuk, nasihat atau cadangan kewangan, pelaburan, dagangan atau jenis lain yang diberikan atau disahkan oleh TradingView. Baca lebih dalam Terma Penggunaan.
Skrip sumber terbuka
Dalam semangat TradingView sebenar, pencipta skrip ini telah menjadikannya sumber terbuka, jadi pedagang boleh menilai dan mengesahkan kefungsiannya. Terima kasih kepada penulis! Walaupuan anda boleh menggunakan secara percuma, ingat bahawa penerbitan semula kod ini tertakluk kepada Peraturan Dalaman.
Penafian
Maklumat dan penerbitan adalah tidak bertujuan, dan tidak membentuk, nasihat atau cadangan kewangan, pelaburan, dagangan atau jenis lain yang diberikan atau disahkan oleh TradingView. Baca lebih dalam Terma Penggunaan.