PROTECTED SOURCE SCRIPT
Weekly Standard Deviations (NQ1!/VXN / ES1!/VIX)
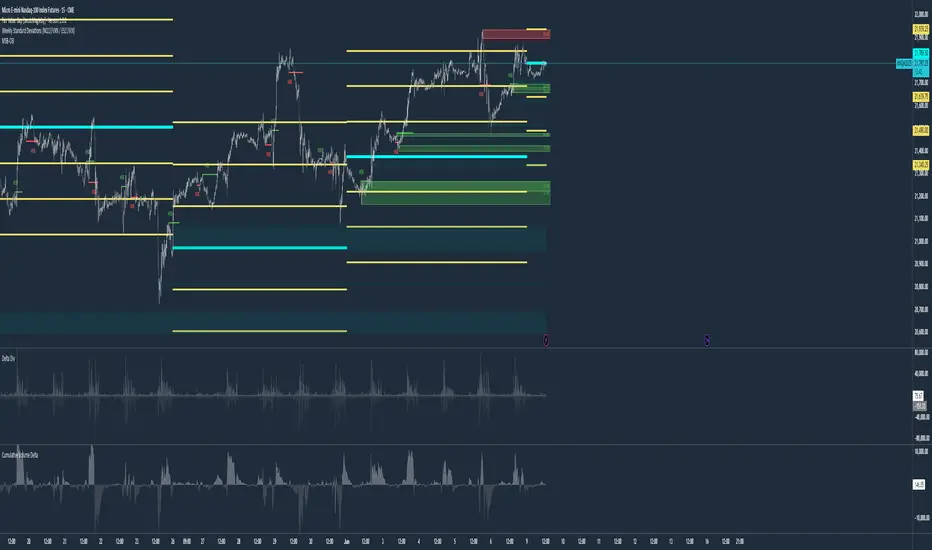
Weekly Standard Deviations (NQ1!/VXN or ES1!/VIX) – Settlement-Based with Robust Volatility Calculation
This indicator displays weekly standard deviation bands for US index futures (NQ1!, ES1!, MNQ1!, MES1!) using a professional approach:
Weekly Settlement as Basis:
The center line ("Mid") is based on the official weekly settlement price of the selected future (using settlement feeds, not just the last traded price). This ensures high accuracy for institutional and systematic trading.
Volatility by VIX/VXN, Friday 5-Minute Close (CET):
The volatility input (σ) is dynamically derived from the VIX or VXN. Specifically, the indicator uses the last available 5-minute close on Friday after 22:00 CET (Central European Time) each week. If there is no data at exactly 22:10 or 22:05 (e.g. shortened sessions or holidays), it falls back to the latest available 5-minute close of that Friday, ensuring reliable calculation in all market conditions.
Standard Deviation Bands:
The ±1σ, ±2σ, and ±3σ bands are calculated from the weekly settlement price and the robust volatility value. These bands are widely used by professionals for mean reversion, volatility trading, and risk management.
Dynamic Holiday Logic:
Includes dynamic holiday calculation for major US market holidays (can be expanded for other regions). This helps to keep calculations consistent even in holiday weeks.
Labels & Visuals:
Each standard deviation level and the center are labeled for easy orientation. All lines are automatically updated at the start of each new week.
Recommended for:
Advanced traders, systematic/quant traders, and anyone who wants an institutional-grade approach to weekly volatility structure in US index futures.
How to Use:
Add to a chart of NQ1!, MNQ1!, ES1!, or MES1! (futures continuous contracts).
Choose your preferred symbol pair (NQ1!/VXN or ES1!/VIX) in the indicator settings.
All calculations and band updates are fully automatic.
This script is for educational and informational purposes only and should not be considered financial advice or a recommendation to buy or sell any security or derivative. Trading futures and derivatives involves substantial risk and is not suitable for every investor. The author of this script accepts no liability for any loss or damage arising from the use of this tool. Always do your own research and consult with a professional financial advisor before making investment decisions.
Skrip dilindungi
Skrip ini diterbitkan sebagai sumber tertutup. Akan tetapi, anda boleh menggunakannya secara bebas dan tanpa apa-apa had – ketahui lebih di sini.
Penafian
Maklumat dan penerbitan adalah tidak bertujuan, dan tidak membentuk, nasihat atau cadangan kewangan, pelaburan, dagangan atau jenis lain yang diberikan atau disahkan oleh TradingView. Baca lebih dalam Terma Penggunaan.