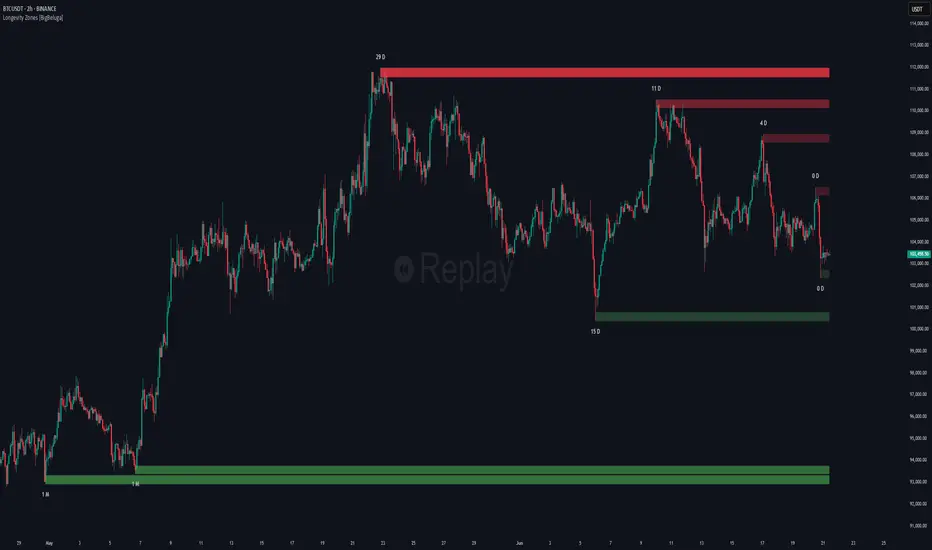
Non-Lagging Longevity Zones [BigBeluga]🔵 OVERVIEW
A clean, non-lagging system for identifying price zones that persist over time—ranking them visually based on how long they survive without being invalidated.
Non-Lagging Longevity Zones uses non-lagging pivots to automatically build upper and lower zones that reflect key resistance and support. These zones are kept alive as long as price respects them and are instantly removed when invalidated. The indicator assigns a unique lifespan label to each zone in Days (D), Months (M), or Years (Y), providing instant context for historical relevance.
🔵 CONCEPTS
Non-Lag Pivot Detection: Detects upper and lower pivots using non-lagging swing identification (highest/lowest over length period).
h = ta.highest(len)
l = ta.lowest(len)
high_pivot = high == h and high < h
low_pivot = low == l and low > l
Longevity Ranking: Zones are preserved as long as price doesn't breach them. Levels that remain intact grow in visual intensity.
Time-Based Weighting: Each zone is labeled with its lifespan in days , emphasizing how long it has survived.
duration = last_bar_index - start
days_ = int(duration*(timeframe.in_seconds("")/60/60/24))
days = days_ >= 365 ? int(days_ / 365) : days_ >= 30 ? int(days_ / 30) : days_
marker = days_ >= 365 ? " Y" : days_ >= 30 ? " M" : " D"
Dynamic Coloring: Older zones are drawn with stronger fill, while newer ones appear fainter—making it easy to assess significance.
Self-Cleaning Logic: If price invalidates a zone, it’s instantly removed, keeping the chart clean and focused.
🔵 FEATURES
Upper and Lower Zones: Auto-detects valid high/low pivots and plots horizontal zones with ATR-based thickness.
Real-Time Validation: Zones are extended only if price stays outside them—giving precise control zones.
Gradient Fill Intensity: The longer a level survives, the more opaque the fill becomes.
Duration-Based Labeling: Time alive is shown at the root of each zone:
• D – short-term zones
• M – medium-term structure
• Y – long-term legacy levels
Smart Zone Clearing: Zones are deleted automatically once invalidated by price, keeping the display accurate.
Efficient Memory Handling: Keeps only the 10 most recent valid levels per side for optimal performance.
🔵 HOW TO USE
Track durable S/R zones that survived price tests without being breached.
Use longer-lived zones as high-confidence confluence areas for entries or targets.
Observe fill intensity to judge structural importance at a glance .
Layer with volume or momentum tools to confirm bounce or breakout probability.
Ideal for swing traders, structure-based traders, or macro analysis.
🔵 CONCLUSION
Non-Lagging Longevity Zones lets the market speak for itself—by spotlighting levels with proven survival over time. Whether you're trading trend continuation, mean reversion, or structure-based reversals, this tool equips you with an immediate read on what price zones truly matter—and how long they've stood the test of time.
Jalur dan Saluran
Market Structure by HorizonAImarket structure with BOS and CHOCH. It has full accuracy. Identify structure and trade accordingly.

Momentum_EMABandThe Momentum EMA Band V1 is a precision tool designed for intraday traders & scalpers. This is the first version of the script, combining three powerful technical elements to help traders identify directional moves while filtering out weak, choppy market phases.
🔧 How the Indicator Works — Combined Logic
This indicator merges well-known but distinct concepts into a unified visual framework:
1️⃣ EMA Price Band — Dynamic Zone Visualization
Plots upper and lower EMA bands based on user input (default: 9-period EMA).
Price relative to the bands provides immediate visual cues:
Green Band: Price above the upper EMA — bullish strength.
Red Band: Price below the lower EMA — bearish pressure.
Yellow Band: Price within the band — neutral zone.
2️⃣ Supertrend Overlay — Reliable Trend Confirmation
ATR-based Supertrend logic (customizable ATR length & factor).
Green Supertrend Line: Uptrend confirmation.
Red Supertrend Line: Downtrend confirmation.
Helps traders ride trends with dynamic levels that adjust to volatility.
3️⃣ ADX-Based No Trade Zone — Choppy Market Filter
Manual ADX calculation measures trend strength (default ADX length: 14).
When ADX is below a user-defined threshold (default: 20) and price is within the EMA Band buffer, a gray background highlights sideways or indecisive market conditions — suggesting no new trade or low momentum zone
Optional gray triangle marker shows the start of each No-Trade Zone phase.
🎯 Key Features
✅ Combines EMA Bands, Supertrend & ADX filtering for comprehensive market context.
✅ Visual No-Trade Zone shading keeps traders out of low-probability setups.
✅ Supertrend Line tracks evolving trend bias.
✅ Fully customizable — adjust EMA, ATR, ADX settings to match different instruments or styles.
✅ Clean, focused chart presentation for easy interpretation.
💡 Practical Application
Momentum Breakouts: Enter trades when price breaks beyond the EMA Band, with Supertrend confirmation.
Avoid Sideways Traps: Refrain from trading during gray-shaded No-Trade Zones, minimizing exposure to whipsaws.
Scalping & Intraday Edge: Particularly effective on lower timeframes where choppy periods are common.
⚠️ Important Disclaimer
This is Version 1 — future versions may expand on features based on trader feedback.
This script is for educational purposes only. Always combine with risk management and thorough strategy validation.
No indicator guarantees profitability — use this tool as part of a broader trading system.

VWMA + ML RSI StrategyVWMA + ML RSI Strategy
This strategy combines the power of Volume-Weighted Moving Average (VWMA) with a Machine Learning-enhanced RSI to generate high-probability long entries.
✅ Buy Logic:
A buy signal is triggered when:
The candle closes above the VWMA
The ML RSI (smoothed using advanced moving averages) is above 60
If only one of the above conditions is met, the strategy waits for the second to confirm before entering.
❌ Sell Logic:
The position is closed when:
The candle closes below the VWMA, and
The ML RSI falls below 40
🎯 Risk Management:
Take Profit: 1.5% above entry
Stop Loss: 1.5% below entry
🤖 ML RSI Explanation:
The ML RSI is a refined version of the traditional RSI using smoothing techniques (like ALMA, EMA, etc.) to reduce noise and enhance responsiveness to price action. It helps filter out weak signals and improves trend confirmation.
🔧 Customization:
Adjustable VWMA length
Configurable ML RSI smoothing method, length, and ALMA sigma
Thresholds for entry/exit RSI levels

15-Minute King (VWAP + Z-Score + CVD Oscillator)fridrich instituational secret . ( limited time only 4 free )

trade bang mongIndicator Name:
🔺 Key Swing Zones Based on Breakouts (Line-Based)
Short Description:
This indicator automatically detects and visualizes key swing highs and lows based on the principle of candle close breaking the wick of the previous candle, then classifies the current market trend as uptrend, downtrend, or neutral. It draws horizontal lines representing key zones and adds visual labels to help traders analyze market structure more clearly.

EMAs 60/125/250 + Swing-Struktur + CCI-AlertsEMAs 60/125/250 + Swing-Points + CCI-Alerts / crossover 100 /-100

Vùng đỉnh đáy chính theo phá vỡ (dùng line)Indicator Name:
🔺 Key Swing Zones Based on Breakouts (Line-Based)
Short Description:
This indicator automatically detects and visualizes key swing highs and lows based on the principle of candle close breaking the wick of the previous candle, then classifies the current market trend as uptrend, downtrend, or neutral. It draws horizontal lines representing key zones and adds visual labels to help traders analyze market structure more clearly.
How It Works:
🔹 Reversal Signal Logic:
In an uptrend, if a candle closes below the previous candle's low, it marks a swing low.
In a downtrend, if a candle closes above the previous candle's high, it marks a swing high.
🔹 Structure Break Detection:
Price breaking above a key high → confirms an uptrend.
Price breaking below a key low → confirms a downtrend.
If price breaks a zone but doesn't form a new high/low → switches to neutral.
🔹 Visual Display:
Draws two horizontal lines: one at the key high, one at the key low.
Adds labels "Key High" or "Key Low" at the breakout points.
Zone color representation:
🟢 Green = Uptrend
🔴 Red = Downtrend
⚪ White = Neutral

SMA Ratio w/ RSI, BB & EMAOverview:
This strategy combines signal-based trend logic with advanced volatility filters, RSI confirmation, dynamic stop-loss/take-profit levels, and higher-timeframe (HTF) trend validation. A fully visual dashboard provides live feedback on market conditions, win rates, and current signal strength.
Key Features:
🔁 Dynamic Stop-Loss/Take-Profit based on ATR and signal strength
📶 Gradient Signal Strength using custom SMA/EMA crossovers
📊 Higher Timeframe Trend Filter for directional bias
🌀 Bollinger Band Squeeze Filter to detect low-volatility breakout zones
💹 RSI Filter to avoid overbought/oversold traps
🧠 Signal Classification: Detects LH/HL Buy/Sell setups and displays them as labels (e.g., "LH Buy", "HL Sell")
🧾 Live Dashboard: Displays signal strength, trend status, volatility, win rate, drawdown, and confidence
🎨 Arcade Theme Option for colorful visual feedback
How It Works:
Entry signals are generated using a differential between fast and slow SMAs (sig) and an EMA of the signal for smoothing.
ATR and Bollinger Band widths adjust SL/TP zones based on market volatility.
Higher timeframe EMA determines bullish or bearish market bias.
Confirmations require RSI agreement and a Bollinger Band squeeze breakout.
Trade Classification Logic:
LH Buy/Sell = Lower High → potential weak reversal
HL Buy/Sell = Higher Low → potential strength after correction
These are shown with labels on the chart to help you assess trade strength visually.
Best Use:
Works on various timeframes
Suitable for trend-following strategies with volatility-based exits
Ideal for traders who want clarity and visual feedback on trade quality
⚠️ Disclaimer: This is a strategy script for educational purposes only. Always test thoroughly on demo accounts before using with real capital.

Мой скрипт//@version=5
indicator("Momentum Reversal Zones Strategy", overlay=true)
// === INPUTS ===
rsiLength = input.int(14, title="RSI Length")
stochK = input.int(14, title="Stochastic %K")
stochD = input.int(3, title="Stochastic %D")
rsiOverbought = input.int(70, title="RSI Overbought Level")
rsiOversold = input.int(30, title="RSI Oversold Level")
// === RSI ===
rsi = ta.rsi(close, rsiLength)
// === Stochastic Oscillator ===
k = ta.stoch(close, high, low, stochK)
d = ta.sma(k, stochD)
// === Buy Signal Conditions ===
rsiBuy = rsi < rsiOversold
stochBuy = ta.crossover(k, d) and k < 20
buySignal = rsiBuy and stochBuy
// === Sell Signal Conditions ===
rsiSell = rsi > rsiOverbought
stochSell = ta.crossunder(k, d) and k > 80
sellSignal = rsiSell and stochSell
// === Plot signals ===
plotshape(buySignal, title="Buy Signal", location=location.belowbar, color=color.green, style=shape.arrowup, size=size.small, text="BUY")
plotshape(sellSignal, title="Sell Signal", location=location.abovebar, color=color.red, style=shape.arrowdown, size=size.small, text="SELL")
// === Alerts ===
alertcondition(buySignal, title="Buy Alert", message="Buy Signal: RSI < 30 and Stochastic Bullish Crossover")
alertcondition(sellSignal, title="Sell Alert", message="Sell Signal: RSI > 70 and Stochastic Bearish Crossover")
// === Show RSI and Stochastic in separate panel ===
plot(rsi, title="RSI", color=color.blue, linewidth=1, display=display.none)
hline(rsiOverbought, "Overbought", color=color.red, linestyle=hline.style_dotted, display=display.none)
hline(rsiOversold, "Oversold", color=color.green, linestyle=hline.style_dotted, display=display.none)

Objective Congestion Zones (Price Density)Automatically calculates congestion zones on multiple timezones and can be modified to add more zones

Auto-AVWAP from Recent High/Low + MidlineAutomatically takes AVWAP from recent high/lows and helps in trading

FVG + RSI Sweep M15FVG + RSI Sweep M15 – Smart Liquidity Trading Indicator
This indicator is designed for high-probability intraday trading, optimized for the 15-minute timeframe (M15). It combines:
Fair Value Gap (FVG) detection – reveals price imbalance zones
RSI reversal signals – identifies overbought/oversold exhaustion
Liquidity sweep logic – confirms fakeouts beyond recent highs/lows
Time filter – focuses only on high-volume London & New York sessions
When all conditions align, it generates clean Buy/Sell signals, with automatic TP and SL levels based on risk–reward logic. Ideal for traders seeking 1–2 precise trades per day with minimal noise.

YAS GROUPFOR ALL YAS GROUP MEMBERS
🔥 مؤشر متكامل يجمع بين عدة تقنيات احترافية لتحديد أفضل مناطق الدخول والخروج بدقة عالية:
✅ مناطق الـ Order Blocks القوية (15m, 1H, 4H)
✅ نسب الفيبوناتشي داخل الـ OB لتأكيد نقاط الانعكاس
✅ إشارات شراء وبيع دقيقة مع إمكانية تفعيل فلتر RSI و EMA/SMA
✅ خطوط دعم ومقاومة ديناميكية مبنية على آخر Pivot Highs & Lows
✅ مناسب للسكالبينج، التداول اليومي، وحتى الصفقات المتوسطة والطويلة
🎯 يمكنك التحكم في شروط الفلاتر وتخصيص الفريمات التي تهمك بسهولة من الإعدادات.
💡 هدف المؤشر: مساعدة المتداول في اتخاذ قرارات مدروسة ومبنية على مناطق سيولة وتجمع أوامر حقيقية، وليس فقط إشارات عشوائية.
---
⚠️ ملاحظة:
- لا يعتبر هذا المؤشر نصيحة مالية مباشرة.
- يفضل استخدامه مع إدارة رأس المال ومراعاة الأخبار والتحليل الأساسي.
🔔 لا تنسَ تفعيل التنبيهات للإشارات المهمة!
🔥 A complete all-in-one indicator combining multiple professional techniques to accurately detect the best entry and exit zones:
✅ Strong Order Blocks zones (15m, 1H, 4H)
✅ Fibonacci levels inside OBs to confirm reversal points
✅ Highly precise Buy/Sell signals with optional RSI and EMA/SMA filters
✅ Dynamic Support & Resistance lines based on latest pivot highs & lows
✅ Perfect for scalping, day trading, and swing trading
🎯 Easily customize filters and timeframes directly from the settings.
💡 Goal: Help traders make more confident, well-informed decisions based on real liquidity and order flow zones rather than random signals.
---
⚠️ Disclaimer:
- This indicator is not financial advice.
- Always combine it with proper risk management, fundamental analysis, and market context.
🔔 Don’t forget to set alerts to stay on top of key signals!
مع تحيات محمد الابرزي وقروب ابو سلطان

Siyonacci-powerWith this indicator:
Volume momentum volume line filters the trend.
ATR bands control volatility.
You get alerts for volume mismatch.
MSB peak-bottom breakouts are visible.
MACD momentum histogram in the bottom panel confirms the strength of the signal.

YAS GROUP✅ يحدد لك مناطق الـ Order Blocks القوية (على فريمات 15 دقيقة، 1 ساعة، و4 ساعات).
✅ حاطين فيبو داخل الـ OB عشان تأكد نقاط الارتداد بدقة.
✅ يعطيك إشارات شراء وبيع أدق من الصقر، وتقدر تشغل أو تطفي فلاتر الـ RSI والـ EMA/SMA حسب راحتك.
✅ بعد، فيه خطوط دعم ومقاومة ديناميكية، شغّالة ع آخر Pivot Highs & Lows.
✅ ينفع حق السكالبينج، التداول اليومي، وحتى الصفقات الطويلة.
🎯 من الإعدادات، تقدر تتحكم في الفلاتر والفريمات اللي تباها.
⚠️ ترى هالمؤشر مش نصيحة مالية مباشرة، دايم خلك حذر، وطبّق إدارة رأس مالك عدل.
🔔 ولاتنسى تحط التنبيهات، عشان توصلك الإشارات وأنت مرتاح.
بالتوفيق ، ورزقك إن شاء الله فوووق!
Hey brother, this indicator is fully loaded and super accurate! 🙌🔥
✅ Detects strong Order Blocks (15m, 1H, 4H).
✅ Adds Fibonacci levels inside OBs to confirm precise reversal points.
✅ Gives you super sharp Buy & Sell signals, with optional RSI and EMA/SMA filters you can toggle on/off.
✅ Also has dynamic Support & Resistance lines, based on the latest pivot highs & lows.
✅ Suitable for scalping, day trading, and swing trading.
🎯 You can easily customize filters and select the timeframes you want from the settings.
⚠️ Note: This is not financial advice — always use proper risk management and stay cautious.
🔔 Don't forget to set alerts so you never miss an opportunity.
Good luck and smash those profits! 🚀🔥
مع تحيات قروب ابو سلطان

DIP BUYING by HAZEREAL BUY THE DIP - Educational Price Movement Indicator
This technical indicator is designed for educational purposes to help traders identify potential price reversal opportunities in equity markets, particularly focusing on NASDAQ-100 index tracking instruments and technology sector ETFs.
Key Features:
Monitors price movements relative to recent highs over customizable lookback periods
Identifies two distinct price decline thresholds: standard (5%+) and extreme (12.3%+)
Visual signals with triangular markers and background color zones
Real-time data table showing current metrics and status
Customizable alert system with webhook-ready JSON formatting
Clean overlay design that doesn't obstruct price action
How It Works:
The indicator tracks the highest price within a specified lookback period and calculates the percentage decline from that high. When price drops below the minimum threshold, it generates visual buy signals. The extreme threshold triggers enhanced alerts for more significant market movements.
Best Use Cases:
Educational analysis of market volatility patterns
Identifying potential support levels during market corrections
Studying historical price behavior around significant declines
Risk management and position sizing education
Important Note: This is a technical analysis tool for educational purposes only. All trading decisions should be based on comprehensive analysis and appropriate risk management. Past performance does not guarantee future results.

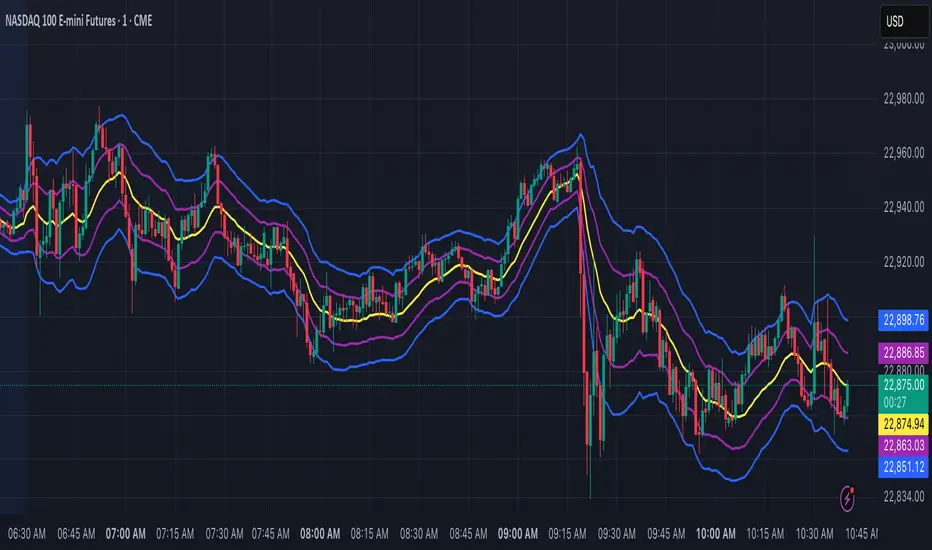
Dynamic Ray BandsAbout Dynamic Ray Bands
Dynamic Ray Bands is a volatility-adaptive envelope indicator that adjusts in real time to evolving market conditions. It uses a Double Exponential Moving Average (DEMA) as its central trend reference, with upper and lower bands scaled according to current volatility measured by the Average True Range (ATR).
This creates a dynamic structure that visually frames price action, helping traders identify areas of potential trend continuation, overextension, or mean reversion.
How It Works
🟡 Centerline (DEMA)
The central yellow line is a Double Exponential Moving Average, which offers a smoother, less laggy trend signal than traditional moving averages. It represents the market’s short- to medium-term “equilibrium.”
🔵 Outer Bands
Plotted at:
Upper Band = DEMA + (ATR × outerMultiplier)
Lower Band = DEMA - (ATR × outerMultiplier)
These bands define the extreme bounds of current volatility. When price breaks above or below them, it can signal strong directional momentum or overbought/oversold conditions, depending on context. They're often used as trend breakout zones or to time exits after extended runs.
🟣 Inner Bands
Plotted closer to the DEMA:
Inner Upper = DEMA + (ATR × innerMultiplier)
Inner Lower = DEMA - (ATR × innerMultiplier)
These are preliminary volatility thresholds, offering early cues for potential expansion or reversal. They may be used for scalping, tight stop zones, or pre-breakout positioning.
🔁 Dynamic Width (Bands are Dynamically Adjusted Per Tick)
The width of both inner and outer bands is based on ATR (Average True Range), which is recalculated in real time. This means:
During high volatility, the bands expand, allowing for wider price fluctuations.
During low volatility, the bands contract, tightening range expectations.
Unlike fixed-width channels or standard Bollinger Bands (which use standard deviation), this per-tick adjustment via ATR enables Dynamic Ray Bands to reduce false signals in choppy markets and remain more reactive during trending conditions.
⚙️ Inputs
DMA Length — Period for the central DEMA.
ATR Length — Lookback used for ATR volatility calculations.
Outer Band Multiplier — Controls sensitivity of extreme bands.
Inner Band Multiplier — Controls proximity of inner bands.
Show Inner Bands — Toggle for plotting the inner zone.
🔔 Alerts
Alert conditions are included for:
Price closing above/below the outer bands (trend momentum or overextension)
Price closing above/below the inner bands (early signs of strength/weakness)
🧭 Use Cases
Breakout detection — Catch price continuation beyond the outer bands.
Volatility filtering — Adjust trade logic based on band width.
Mean reversion — Monitor for snapbacks toward the DEMA after price stretches too far.
Trend guidance — Use band slope and price position to confirm direction.
⚠️ Disclaimer
This script is intended for educational and informational purposes only. It does not constitute financial advice or a recommendation to trade any specific market or security. Always test indicators thoroughly before using them in live trading.
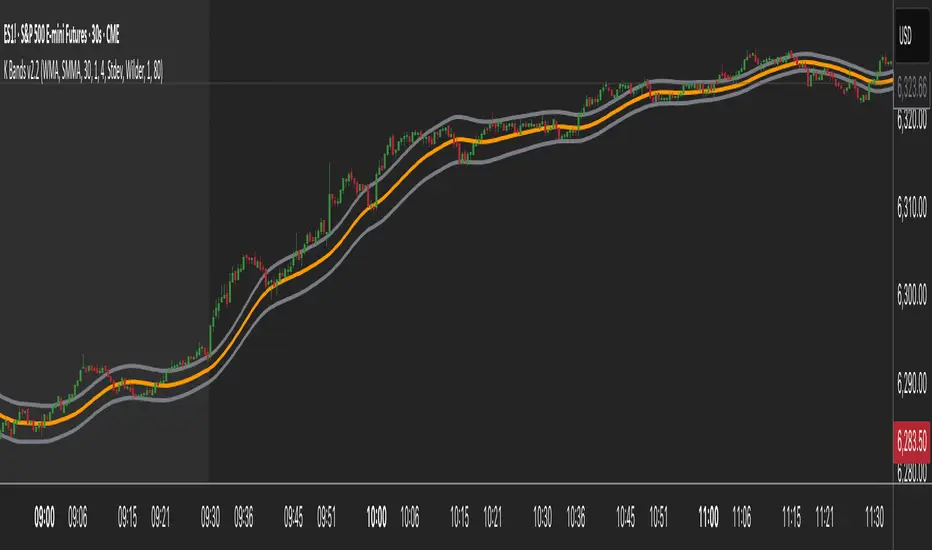
K Bands v2.2K Bands v2 - Settings Breakdown (Timeframe Agnostic)
K Bands v2 is an adaptive volatility envelope tool designed for flexibility across different trading
styles and timeframes.
The settings below allow complete control over how the bands are constructed, smoothed, and how
they respond to market volatility.
1. Upstream MA Type
Controls the core smoothing applied to price before calculating the bands.
Options:
- EMA: Fast, responsive, reacts quickly to price changes.
- SMA: Classic moving average, slower but provides stability.
- Hull: Ultra smooth, reduces noise significantly but may react differently to choppy conditions.
- GeoMean: Geometric mean smoothing, creates a unique, slightly smoother line.
- SMMA: Wilder-style smoothing, balances noise reduction and responsiveness.
- WMA: Weighted Moving Average, emphasizes recent price action for sharper responsiveness.
2. Smoothing Length
Lookback period for the upstream moving average.
- Lower values: Faster reaction, captures short-term shifts.
- Higher values: Smoother trend depiction, filters out noise.
3. Multiplier
Determines the width of the bands relative to calculated volatility.
- Lower multiplier: Tighter bands, more signals, but increased false breakouts.
- Higher multiplier: Wider bands, fewer false signals, more conservative.
4. Downstream MA Type
Applies final smoothing to the band plots after initial calculation.
Same options as Upstream MA.
5. Downstream Smoothing Length
Lookback period for downstream smoothing.
- Lower: More responsive bands.
- Higher: Smoother, visually cleaner bands.
6. Band Width Source
Selects the method used to calculate band width based on market volatility.
Options:
- ATR (Average True Range): Smooth, stable bands based on price range expansion.
- Stdev (Standard Deviation): More reactive bands highlighting short-term volatility spikes.
7. ATR Smoothing Type
Controls how the ATR or Stdev value is smoothed before applying to band width.
Options:
- Wilder: Classic, stable smoothing.
- SMA: Simple moving average smoothing.
- EMA: Faster, more reactive smoothing.
- Hull: Ultra-smooth, noise-reducing smoothing.
- GeoMean: Geometric mean smoothing.
8. ATR Length
Lookback period for smoothing the volatility measurement (ATR or Stdev).
- Lower: More reactive bands, captures quick shifts.
- Higher: Smoother, more stable bands.
9. Dynamic Multiplier Based on Volatility
Allows the band multiplier to adapt automatically to changes in market volatility.
- ON: Bands expand during high volatility and contract during low volatility.
- OFF: Bands remain fixed based on the set multiplier.
10. Dynamic Multiplier Sensitivity
Controls how aggressively the dynamic multiplier responds to volatility changes.
- Lower values: Subtle adjustments.
- Higher values: More aggressive band expansion/contraction.
K Bands v2 is designed to be adaptable across any market or timeframe, helping visualize price
structure, trend, and volatility behavior.
Sanuja nuwanThe Zero Fear Indicator is a custom-built trading tool designed for confident and precise entries. Powered by real-time market structure, volume pressure, and volatility logic, it filters out noise and shows clear buy/sell signals with zero hesitation. Perfect for both beginners and experienced traders looking to trade without fear.

3.RSI LIJO 45*55//@version=6
indicator(title="3.RSI LIJO 45*55", shorttitle="RSI-LIJO-45-55", format=format.price, precision=2, timeframe="", timeframe_gaps=true)
rsiLengthInput = input.int(9, minval=1, title="RSI Length", group="RSI Settings")
rsiSourceInput = input.source(close, "Source", group="RSI Settings")
calculateDivergence = input.bool(false, title="Calculate Divergence", group="RSI Settings", display=display.data_window, tooltip="Calculating divergences is needed in order for divergence alerts to fire.")
change = ta.change(rsiSourceInput)
up = ta.rma(math.max(change, 0), rsiLengthInput)
down = ta.rma(-math.min(change, 0), rsiLengthInput)
rsi = down == 0 ? 100 : up == 0 ? 0 : 100 - (100 / (1 + up / down))
// Change RSI line color based on bands
rsiColor = rsi > 50 ? color.green : rsi < 50 ? color.red : color.white
rsiPlot = plot(rsi, "RSI", color=rsiColor)
rsiUpperBand = hline(55, "RSI Upper Band", color=color.rgb(5, 247, 22))
midline = hline(50, "RSI Middle Band", color=color.new(#787B86, 50))
rsiLowerBand = hline(45, "RSI Lower Band", color=color.rgb(225, 18, 14))
fill(rsiUpperBand, rsiLowerBand, color=color.rgb(126, 87, 194, 90), title="RSI Background Fill")
midLinePlot = plot(50, color=na, editable=false, display=display.none)
fill(rsiPlot, midLinePlot, 100, 55, top_color=color.new(color.green, 0), bottom_color=color.new(color.green, 100), title="Overbought Gradient Fill")
fill(rsiPlot, midLinePlot, 45, 0, top_color=color.new(color.red, 100), bottom_color=color.new(color.red, 0), title="Oversold Gradient Fill")
// Smoothing MA inputs
GRP = "Smoothing"
TT_BB = "Only applies when 'SMA + Bollinger Bands' is selected. Determines the distance between the SMA and the bands."
maTypeInput = input.string("SMA", "Type", options= , group=GRP, display=display.data_window)
maLengthInput = input.int(31, "Length", group=GRP, display=display.data_window)
bbMultInput = input.float(2.0, "BB StdDev", minval=0.001, maxval=50, step=0.5, tooltip=TT_BB, group=GRP, display=display.data_window)
var enableMA = maTypeInput != "None"
var isBB = maTypeInput == "SMA + Bollinger Bands"
// Smoothing MA Calculation
ma(source, length, MAtype) =>
switch MAtype
"SMA" => ta.sma(source, length)
"SMA + Bollinger Bands" => ta.sma(source, length)
"EMA" => ta.ema(source, length)
"SMMA (RMA)" => ta.rma(source, length)
"WMA" => ta.wma(source, length)
"VWMA" => ta.vwma(source, length)
// Smoothing MA plots
smoothingMA = enableMA ? ma(rsi, maLengthInput, maTypeInput) : na
smoothingStDev = isBB ? ta.stdev(rsi, maLengthInput) * bbMultInput : na
plot(smoothingMA, "RSI-based MA", color=color.yellow, display=enableMA ? display.all : display.none, editable=enableMA)
bbUpperBand = plot(smoothingMA + smoothingStDev, title="Upper Bollinger Band", color=color.green, display=isBB ? display.all : display.none, editable=isBB)
bbLowerBand = plot(smoothingMA - smoothingStDev, title="Lower Bollinger Band", color=color.green, display=isBB ? display.all : display.none, editable=isBB)
fill(bbUpperBand, bbLowerBand, color=isBB ? color.new(color.green, 90) : na, title="Bollinger Bands Background Fill", display=isBB ? display.all : display.none, editable=isBB)
// Divergence
lookbackRight = 5
lookbackLeft = 5
rangeUpper = 60
rangeLower = 5
bearColor = color.red
bullColor = color.green
textColor = color.white
noneColor = color.new(color.white, 100)
_inRange(bool cond) =>
bars = ta.barssince(cond)
rangeLower <= bars and bars <= rangeUpper
plFound = false
phFound = false
bullCond = false
bearCond = false
rsiLBR = rsi
if calculateDivergence
//------------------------------------------------------------------------------
// Regular Bullish
// rsi: Higher Low
plFound := not na(ta.pivotlow(rsi, lookbackLeft, lookbackRight))
rsiHL = rsiLBR > ta.valuewhen(plFound, rsiLBR, 1) and _inRange(plFound )
// Price: Lower Low
lowLBR = low
priceLL = lowLBR < ta.valuewhen(plFound, lowLBR, 1)
bullCond := priceLL and rsiHL and plFound
//------------------------------------------------------------------------------
// Regular Bearish
// rsi: Lower High
phFound := not na(ta.pivothigh(rsi, lookbackLeft, lookbackRight))
rsiLH = rsiLBR < ta.valuewhen(phFound, rsiLBR, 1) and _inRange(phFound )
// Price: Higher High
highLBR = high
priceHH = highLBR > ta.valuewhen(phFound, highLBR, 1)
bearCond := priceHH and rsiLH and phFound
plot(
plFound ? rsiLBR : na,
offset = -lookbackRight,
title = "Regular Bullish",
linewidth = 2,
color = (bullCond ? bullColor : noneColor),
display = display.pane,
editable = calculateDivergence)
plotshape(
bullCond ? rsiLBR : na,
offset = -lookbackRight,
title = "Regular Bullish Label",
text = " Bull ",
style = shape.labelup,
location = location.absolute,
color = bullColor,
textcolor = textColor,
display = display.pane,
editable = calculateDivergence)
plot(
phFound ? rsiLBR : na,
offset = -lookbackRight,
title = "Regular Bearish",
linewidth = 2,
color = (bearCond ? bearColor : noneColor),
display = display.pane,
editable = calculateDivergence)
plotshape(
bearCond ? rsiLBR : na,
offset = -lookbackRight,
title = "Regular Bearish Label",
text = " Bear ",
style = shape.labeldown,
location = location.absolute,
color = bearColor,
textcolor = textColor,
display = display.pane,
editable = calculateDivergence)
alertcondition(bullCond, title='Regular Bullish Divergence', message="Found a new Regular Bullish Divergence, Pivot Lookback Right number of bars to the left of the current bar.")
alertcondition(bearCond, title='Regular Bearish Divergence', message='Found a new Regular Bearish Divergence, Pivot Lookback Right number of bars to the left of the current bar.')

ETH Mean Reversion Strategy [VWAP + EMA + Bollinger]Mean Reversion Strategy using VWAP, EMA, and Bollinger Bands, with entry signals and target lines:

9 EMA Angle + Price % Filter//@version=5
indicator("9 EMA Angle + Price % Filter", overlay=true)
length = 9
emaLine = ta.ema(close, length)
// === INPUTS ===
angleThreshold = input.float(20, "EMA Angle Threshold (°)")
pricePercentThreshold = input.float(80, "Price % Above/Below EMA")
// === PRICE DISTANCE FROM EMA IN % ===
percentAbove = close >= emaLine ? ((close - emaLine) / emaLine) * 100 : 0
percentBelow = close < emaLine ? ((emaLine - close) / emaLine) * 100 : 0
// === ANGLE CALCULATION ===
lookbackBars = input.int(5, "Bars for Angle Calculation")
p1 = emaLine
p2 = emaLine
deltaY = p1 - p2
deltaX = lookbackBars
angleRadians = math.atan(deltaY / deltaX)
angleDegrees = angleRadians * 180 / math.pi
// === CONDITIONS ===
isFlat = percentAbove < pricePercentThreshold and percentBelow < pricePercentThreshold and angleDegrees > -angleThreshold and angleDegrees < angleThreshold
isPriceAbove = percentAbove >= pricePercentThreshold
isPriceBelow = percentBelow >= pricePercentThreshold
isAngleUp = angleDegrees >= angleThreshold
isAngleDown = angleDegrees <= -angleThreshold
// === EMA COLOR LOGIC ===
emaColor = isFlat ? color.black :
isAngleUp or isPriceAbove ? color.green :
isAngleDown or isPriceBelow ? color.red : color.gray
// === PLOT EMA ===
plot(emaLine, "9 EMA", color=emaColor, linewidth=2)
