PROTECTED SOURCE SCRIPT
Wave Collapse Simulation - Confirmation of New Trend
This Pine Script, titled "Wave Collapse Simulation - Confirmation of New Trend," is an advanced indicator designed to identify high-conviction trend changes. It operates on the principle of a "wave collapse," a metaphor for a moment when market uncertainty resolves into a new, confirmed direction. It identifies these moments by combining signals from market structure, trend-following moving averages, and a spike in volatility. The indicator plots its signals directly on the price chart
The core idea is that a stable trend (making higher highs and higher lows, or vice-versa) will eventually fail. This script pinpoints the exact moment this failure is confirmed by a significant price move that breaks key levels, signaling the start of a new trend.
Key Components
1. Multi-Length Pivot Analysis
Instead of relying on a single lookback period, the script analyzes market structure using up to ten different pivot lengths (e.g., 2, 3, 5, 7, 11...).
Structural Failure: It constantly monitors these pivots to see if the market fails to make a new higher high in an uptrend (higherHighsFailed) or a new lower low in a downtrend (lowerLowsFailed). A failure in this pattern is the first sign that the prevailing trend is weakening.
2. Trend Context and Volatility Trigger
The script uses two additional components to validate a potential trend change:
Long-Term Trend: Two slow-moving averages (999 and 3000 periods) are used to establish the dominant, long-term trend direction. A signal can only occur if it aligns with a break of this established trend.
Volatility Spike: It uses the Average True Range (ATR) to detect a sudden, powerful price movement. A "collapse" is only considered valid if the price moves more than a specified multiple of the ATR, ensuring the signal is backed by significant market force and not just noise.
3. The "Collapse" Event
This is the central logic of the indicator. A bullish or bearish collapse is a high-probability signal triggered only when three specific conditions are met simultaneously:
Bullish Collapse (New Uptrend):
Structure: The market has failed to make new lower lows.
Trend Break: The price breaks above the short-term moving average during a long-term downtrend.
Volatility: The move is accompanied by a significant volatility spike.
Bearish Collapse (New Downtrend):
Structure: The market has failed to make new higher highs.
Trend Break: The price breaks below the short-term moving average during a long-term uptrend.
Volatility: The move is accompanied by a significant volatility spike.
4. Gaussian Probability Simulation
The script includes a Gaussian (normal distribution) function to model market certainty.
Sigma (σ): This variable represents the standard deviation, or "uncertainty." After a collapse event, sigma is reset to a very small value, representing a moment of high certainty about the new trend.
Decay: If no new collapse occurs, sigma gradually increases with each bar, representing the return of uncertainty to the market. While the script calculates the probabilities for a price distribution (the "wave"), its primary function is to use the state of sigma to define the collapse event itself, rather than plotting a visual wave.
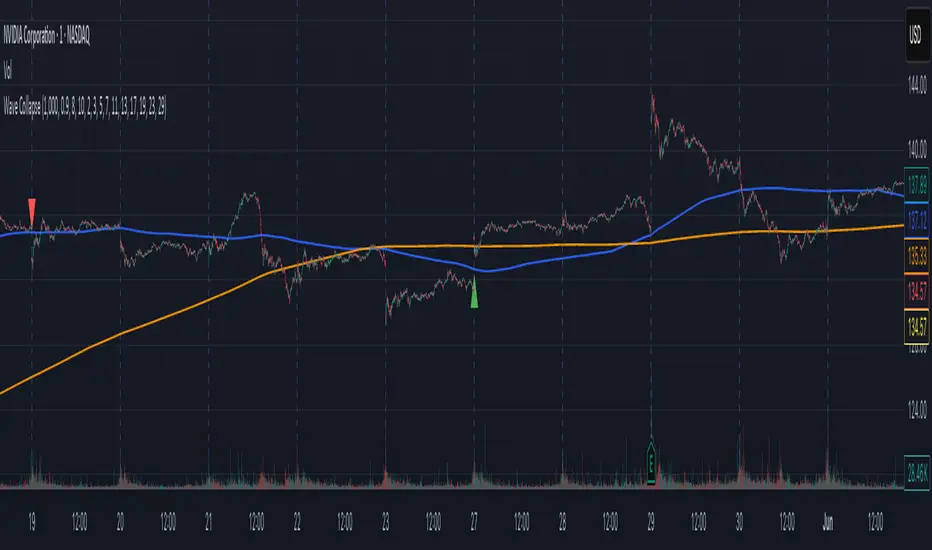
How It Appears on the Chart
Moving Averages: The long-term maShort (blue) and maLong (orange) are plotted to show the underlying trend context.
Collapse Signals:
A green triangle is plotted below the price bar to signal a Bullish Collapse.
A red triangle is plotted above the price bar to signal a Bearish Collapse.
Collapse Price: A horizontal red line appears at the price where the collapse was triggered, serving as a key reference level for the new trend.


The core idea is that a stable trend (making higher highs and higher lows, or vice-versa) will eventually fail. This script pinpoints the exact moment this failure is confirmed by a significant price move that breaks key levels, signaling the start of a new trend.
Key Components
1. Multi-Length Pivot Analysis
Instead of relying on a single lookback period, the script analyzes market structure using up to ten different pivot lengths (e.g., 2, 3, 5, 7, 11...).
Structural Failure: It constantly monitors these pivots to see if the market fails to make a new higher high in an uptrend (higherHighsFailed) or a new lower low in a downtrend (lowerLowsFailed). A failure in this pattern is the first sign that the prevailing trend is weakening.
2. Trend Context and Volatility Trigger
The script uses two additional components to validate a potential trend change:
Long-Term Trend: Two slow-moving averages (999 and 3000 periods) are used to establish the dominant, long-term trend direction. A signal can only occur if it aligns with a break of this established trend.
Volatility Spike: It uses the Average True Range (ATR) to detect a sudden, powerful price movement. A "collapse" is only considered valid if the price moves more than a specified multiple of the ATR, ensuring the signal is backed by significant market force and not just noise.
3. The "Collapse" Event
This is the central logic of the indicator. A bullish or bearish collapse is a high-probability signal triggered only when three specific conditions are met simultaneously:
Bullish Collapse (New Uptrend):
Structure: The market has failed to make new lower lows.
Trend Break: The price breaks above the short-term moving average during a long-term downtrend.
Volatility: The move is accompanied by a significant volatility spike.
Bearish Collapse (New Downtrend):
Structure: The market has failed to make new higher highs.
Trend Break: The price breaks below the short-term moving average during a long-term uptrend.
Volatility: The move is accompanied by a significant volatility spike.
4. Gaussian Probability Simulation
The script includes a Gaussian (normal distribution) function to model market certainty.
Sigma (σ): This variable represents the standard deviation, or "uncertainty." After a collapse event, sigma is reset to a very small value, representing a moment of high certainty about the new trend.
Decay: If no new collapse occurs, sigma gradually increases with each bar, representing the return of uncertainty to the market. While the script calculates the probabilities for a price distribution (the "wave"), its primary function is to use the state of sigma to define the collapse event itself, rather than plotting a visual wave.
How It Appears on the Chart
Moving Averages: The long-term maShort (blue) and maLong (orange) are plotted to show the underlying trend context.
Collapse Signals:
A green triangle is plotted below the price bar to signal a Bullish Collapse.
A red triangle is plotted above the price bar to signal a Bearish Collapse.
Collapse Price: A horizontal red line appears at the price where the collapse was triggered, serving as a key reference level for the new trend.
Skrip dilindungi
Skrip ini diterbitkan sebagai sumber tertutup. Akan tetapi, anda boleh menggunakannya secara bebas dan tanpa apa-apa had – ketahui lebih di sini.
Penafian
Maklumat dan penerbitan adalah tidak bertujuan, dan tidak membentuk, nasihat atau cadangan kewangan, pelaburan, dagangan atau jenis lain yang diberikan atau disahkan oleh TradingView. Baca lebih dalam Terma Penggunaan.