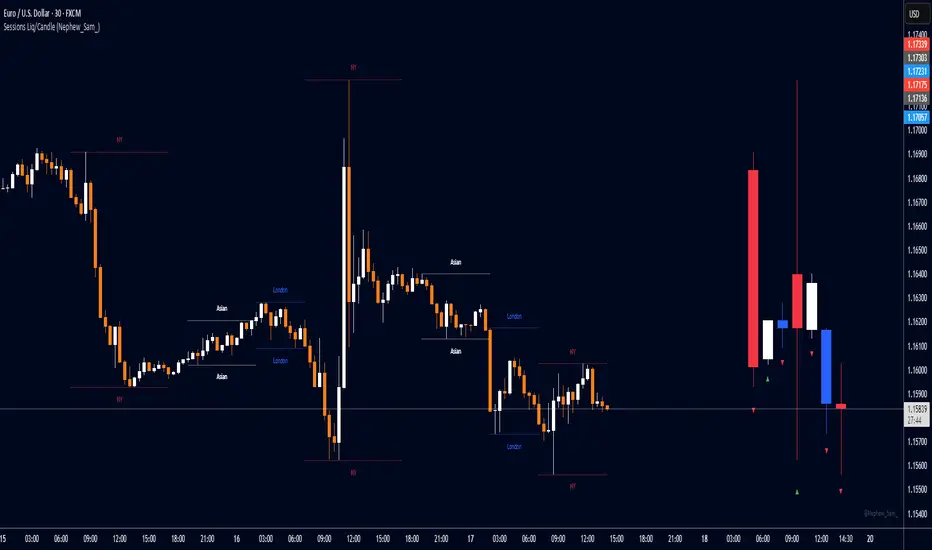
Session HL + Candles + AMD (Nephew_Sam_)Session HL + Candles + AMD (Nephew_Sam_)
This indicator marks out intraday sessions summarized into single candles, with an additional option to mark out the HL of each session. Perfect for understanding AMD within a glance (accumulation-manipulation-distribution)
Features:
Session High/Low lines with customizable colors and labels
Optional session candles displayed on the right side of the chart
Timezone support for global traders
Customizable bull/bear candle colors
Works on timeframes up to 1 hour
Perfect for:
Identifying session liquidity levels
Tracking session ranges and breakouts
Multi-timeframe session analysis
ICT methodology traders
Settings:
Choose your timezone for accurate session detection
Toggle session candles and HL lines independently
Customize colors, line styles, and labels
Set maximum timeframe (up to 1 hour)
Corak carta
Expansion Triangle [TradingFinder] MegaPhone Broadening🔵 Introduction
The Expanding Triangle, also known as the Broadening Formation, is one of the key technical analysis patterns that clearly reflects growing market volatility, increasing indecision among participants, and the potential for sharp price explosions.
This pattern is typically defined by a sequence of higher highs and lower lows, forming within two diverging trendlines. Unlike traditional triangles that converge to a breakout point, the expanding triangle pattern becomes wider over time, leaving no precise apex for a breakout to occur.
From a price action perspective, the pattern represents a prolonged tug-of-war between buyers and sellers, where neither side has taken control yet. Each aggressive swing opens the door to new opportunities whether it's a trend reversal, range trading, or a momentum breakout. This dual nature makes the pattern highly versatile across market conditions, from exhausted trend ends to volatile consolidation zones.
The custom-built indicator for this pattern uses a combination of smart algorithms and detailed analysis of swing dynamics to automatically detect expanding triangles and highlight low-risk entry points.
Traders can use this tool to capitalize on high-probability setups from shorting near the upper edge of the structure with confirmation, to trading bearish breakouts during trend continuations, or entering long positions near the lower boundary during bullish reversals. The chart examples included in this article demonstrate these three highly practical trading scenarios in live market conditions.
A major advantage of this indicator lies in its structural filtering engine, which analyzes the behavior of each price leg in the triangle. With four adjustable filter levels from Very Aggressive, which highlights all potential patterns, to Very Defensive, which only triggers when price actually touches the triangle's trendlines the indicator ensures that only structurally sound and verified setups appear on the chart, reducing noise and false signals significantly.
Long Setup :
Short Setup :
🔵 How to Use
The pattern typically forms in conditions of heightened uncertainty and volatility, where price swings generate a series of higher highs and lower lows. The expanding triangle consists of three key legs bounded by diverging trendlines. The indicator intelligently analyzes each leg's direction and angle to determine whether a valid pattern is forming.
At the core of the indicator’s logic is its leg filtering system, which controls the quality of the pattern and filters out weak or noisy setups. Four structural filter modes are available to suit different trading styles and risk preferences. In Very Aggressive mode, filters are disabled, and the indicator detects any pattern purely based on the sequence of swing points.
This mode is ideal for traders who want to see everything and apply their own discretion.
In Aggressive mode, the indicator checks whether each new leg extends no more than twice the length of the previous one. If a leg overshoots excessively, the structure is invalidated.
In Defensive mode, the filter enforces a minimum movement requirement each leg must move at least 2% of the previous one. This prevents the formation of shallow, weak patterns that visually resemble triangles but lack substance.
The strictest setting, Very Defensive, combines all previous filters and additionally requires the price to physically touch the triangle’s trendlines before issuing a signal. This ensures that setups only appear when real market interaction with key structural levels has occurred, not based on assumptions or geometry alone. This mode is ideal for traders seeking maximum precision and minimal risk.
🟣 Bullish Setup
A bullish setup within the Expanding Triangle pattern occurs when price revisits the lower support boundary after a series of broad swings typically near the third leg of the formation. This area often represents a shift in momentum, where sellers begin to lose strength and buyers prepare to take control.
Ideally, the setup is accompanied by a bullish reversal candle (e.g. doji, pin bar, or engulfing) near the lower trendline. If the Very Defensive filter is active, the indicator will only issue a signal if price makes a confirmed touch on the trendline and reacts from that level. This significantly improves signal accuracy and filters out premature entries.
After confirmation, traders may choose to enter a long position on the bullish candle or shortly afterward. A logical stop-loss is placed just below the recent swing low within the pattern. The target can be set at or near the upper trendline, or projected using the full height of the triangle added to the breakout point. On higher timeframes, this reversal often marks the beginning of a strong uptrend.
🟣 Bearish Setup
A bearish setup forms when price climbs toward the upper resistance trendline, usually as the third leg completes. This is where buyers often begin to show exhaustion, and sellers step in with strength providing an ideal low-risk entry point for short positions.
As with the bullish setup, if the Candle Confirmation filter is enabled, the indicator will only show a signal when a bearish reversal candle forms at the point of contact. If Defensive or Very Defensive filters are also active, the setup must meet strict criteria of proportionate leg movement and an actual trendline touch to qualify.
Once confirmed, traders can enter on the reversal candle, placing a stop-loss slightly above the recent high. The target can be set at the lower trendline or calculated based on the triangle's full height, projected downward. This setup is particularly useful at the end of weak bullish trends or in volatile market tops.
🔵 Settings
🟣 Logic Settings
Pivot Period : Defines how many bars are analyzed to identify swing highs and lows. Higher values detect larger, slower structures, while lower values respond to faster patterns. The default value of 13 offers a balanced sensitivity.
Pattern Filter :
Very Aggressive : Detects all patterns based on point sequence with no structural checks.
Aggressive : Ensures each leg is no more than 2x the size of the previous one.
Defensive : Requires each leg to be at least 2% the size of the previous leg.
Very Defensive : The strictest level; only confirms patterns when price touches trendlines.
Candle Confirmation : When enabled, the indicator requires a valid confirmation candle (doji, pin bar, engulfing) at the interaction point with the trendline before issuing a signal. This reduces false entries and improves entry precision.
🟣 Alert Settings
Alert : Enables alerts for SSS.
Message Frequency : Determines the frequency of alerts. Options include 'All' (every function call), 'Once Per Bar' (first call within the bar), and 'Once Per Bar Close' (final script execution of the real-time bar). Default is 'Once per Bar'.
Show Alert Time by Time Zone : Configures the time zone for alert messages. Default is 'UTC'.
🔵 Conclusion
The Expanding Triangle pattern, with its wide structure and volatility-driven nature, represents chaos but also opportunity. For traders who can read its behavior, it provides some of the most powerful setups for reversals, breakouts, and range-based trades. While the pattern may seem messy at first glance, it is built on clear logic and when properly detected, it offers high-probability opportunities.
This indicator doesn’t just draw expanding triangles it intelligently evaluates their structural quality, validates price interaction through candle confirmation, and allows the trader to fine-tune the detection logic through adjustable filter levels. Whether you’re a reversal trader looking for a turning point, or a breakout trader hunting momentum, this tool adapts to your strategy.
In volatile or uncertain markets, where fakeouts and sudden shifts are common, this indicator can become a cornerstone of your trading system helping you turn volatility into structured, high-quality opportunities.

Auto Market Structure BOS & CHOCH [TeamCash]Auto Market Structure
The Auto Market Structure (AMS) indicator automatically maps market structure to guide your trading. Using pivot points, it plots lines and labels to identify Break of Structure (BOS)—a price break of a key level signaling trend continuation—and Change of Character (CHOCH)—a shift in market direction after breaking a swing high/low. How It Works: BITSTAMP:BTCUSD BITSTAMP:ETHUSD AMS detects pivot points across multiple timeframes, marking BOS and CHOCH with white lines (solid for confirmed, dotted for potential) and labels. It automatically tracks level crosses, highlighting trend shifts or continuations. Optional Fibonacci lines (yellow) can be enabled for precise entry and target zones.
Why Use AMS?
Automates market structure analysis for faster, clearer setups.
Pairs with Fibonacci for high-probability entry and exit points.
Works across timeframes, despite minor bugs, for versatile trading.
Ideal for traders combining structure and Fibonacci in BITSTAMP:BTCUSD and BITSTAMP:ETHUSD markets, offering a powerful, evolving tool for technical analysis.

Ultimate Market Structure [Alpha Extract]Ultimate Market Structure
A comprehensive market structure analysis tool that combines advanced swing point detection, imbalance zone identification, and intelligent break analysis to identify high-probability trading opportunities.Utilizing a sophisticated trend scoring system, this indicator classifies market conditions and provides clear signals for structure breaks, directional changes, and fair value gap detection with institutional-grade precision.
🔶 Advanced Swing Point Detection
Identifies pivot highs and lows using configurable lookback periods with optional close-based analysis for cleaner signals. The system automatically labels swing points as Higher Highs (HH), Lower Highs (LH), Higher Lows (HL), and Lower Lows (LL) while providing advanced classifications including "rising_high", "falling_high", "rising_low", "falling_low", "peak_high", and "valley_low" for nuanced market analysis.
swingHighPrice = useClosesForStructure ? ta.pivothigh(close, swingLength, swingLength) : ta.pivothigh(high, swingLength, swingLength)
swingLowPrice = useClosesForStructure ? ta.pivotlow(close, swingLength, swingLength) : ta.pivotlow(low, swingLength, swingLength)
classification = classifyStructurePoint(structureHighPrice, upperStructure, true)
significance = calculateSignificance(structureHighPrice, upperStructure, true)
🔶 Significance Scoring System
Each structure point receives a significance level on a 1-5 scale based on its distance from previous points, helping prioritize the most important levels. This intelligent scoring system ensures traders focus on the most meaningful structure breaks while filtering out minor noise.
🔶 Comprehensive Trend Analysis
Calculates momentum, strength, direction, and confidence levels using volatility-normalized price changes and multi-timeframe correlation. The system provides real-time trend state tracking with bullish (+1), bearish (-1), or neutral (0) direction assessment and 0-100 confidence scoring.
// Calculate trend momentum using rate of change and volatility
calculateTrendMomentum(lookback) =>
priceChange = (close - close ) / close * 100
avgVolatility = ta.atr(lookback) / close * 100
momentum = priceChange / (avgVolatility + 0.0001)
momentum
// Calculate trend strength using multiple timeframe correlation
calculateTrendStrength(shortPeriod, longPeriod) =>
shortMA = ta.sma(close, shortPeriod)
longMA = ta.sma(close, longPeriod)
separation = math.abs(shortMA - longMA) / longMA * 100
strength = separation * slopeAlignment
❓How It Works
🔶 Imbalance Zone Detection
Identifies Fair Value Gaps (FVGs) between consecutive candles where price gaps create unfilled areas. These zones are displayed as semi-transparent boxes with optional center line mitigation tracking, highlighting potential support and resistance levels where institutional players often react.
// Detect Fair Value Gaps
detectPriceImbalance() =>
currentHigh = high
currentLow = low
refHigh = high
refLow = low
if currentOpen > currentClose
if currentHigh - refLow < 0
upperBound = currentClose - (currentClose - refLow)
lowerBound = currentClose - (currentClose - currentHigh)
centerPoint = (upperBound + lowerBound) / 2
newZone = ImbalanceZone.new(
zoneBox = box.new(bar_index, upperBound, rightEdge, lowerBound,
bgcolor=bullishImbalanceColor, border_color=hiddenColor)
)
🔶 Structure Break Analysis
Determines Break of Structure (BOS) for trend continuation and Directional Change (DC) for trend reversals with advanced classification as "continuation", "reversal", or "neutral". The system compares pre-trend and post-trend states for each break, providing comprehensive trend change momentum analysis.
🔶 Intelligent Zone Management
Features partial mitigation tracking when price enters but doesn't fully fill zones, with automatic zone boundary adjustment during partial fills. Smart array management keeps only recent structure points for optimal performance while preventing duplicate signals from the same level.
🔶 Liquidity Zone Detection
Automatically identifies potential liquidity zones at key structure points for institutional trading analysis. The system tracks broken structure points and provides adaptive zone extension with configurable time-based limits for imbalance areas.
🔶 Visual Structure Mapping
Provides clear visual indicators including swing labels with color-coded significance levels, dashed lines connecting break points with BOS/DC labels, and break signals for continuation and reversal patterns. The adaptive zones feature smart management with automatic mitigation tracking.
🔶 Market Structure Interpretation
HH/HL patterns indicate bullish market structure with trend continuation likelihood, while LH/LL patterns signal bearish structure with downtrend continuation expected. BOS signals represent structure breaks in trend direction for continuation opportunities, while DC signals warn of potential reversals.
🔶 Performance Optimization
Automatic cleanup of old structure points (keeps last 8 points), recent break tracking (keeps last 5 break events), and efficient array management ensure smooth performance across all timeframes and market conditions.
Why Choose Ultimate Market Structure ?
This indicator provides traders with institutional-grade market structure analysis, combining multiple analytical approaches into one comprehensive tool. By identifying key structure levels, imbalance zones, and break patterns with advanced significance scoring, it helps traders understand market dynamics and position themselves for high-probability trade setups in alignment with smart money concepts. The sophisticated trend scoring system and intelligent zone management make it an essential tool for any serious trader looking to decode market structure with precision and confidence.


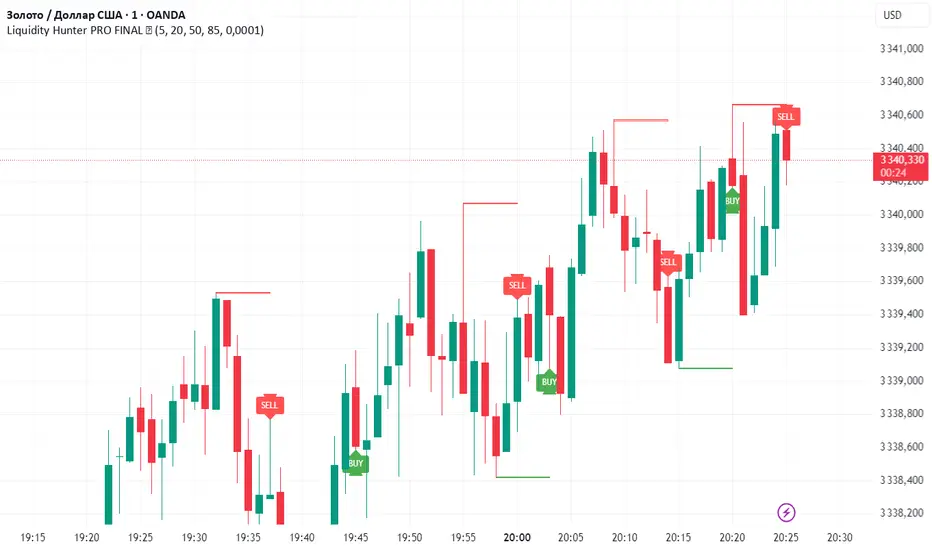
Liquidity Hunter PRO FINAL ✅Liquidity Hunter PRO ✅ is a smart tool designed for traders who want to spot key liquidity sweeps and hunt stop runs with precision.
🔑 How it works:
Automatically plots significant swing highs and lows (liquidity levels) using pivots.
Monitors these levels in real-time and detects when price sweeps above highs or below lows.
Draws clear lines, boxes, and sweep zones to visualize where liquidity was grabbed.
Highlights BUY/SELL opportunities after stop hunts with clean triangle markers and labels.
Fully customizable: set pivot lookback, maximum levels, line age, buffer zone, and visual style.
📌 Features:
✔️ Automatic swing high/low detection
✔️ Dynamic liquidity sweep boxes
✔️ BUY/SELL labels and triangle signals
✔️ Alerts for sweeps above highs and below lows
✔️ Adjustable buffer and line lifetime
✔️ Lightweight, clear and easy to use
💡 Idea: This script helps traders follow Smart Money Concepts (SMC) by showing where the market hunts liquidity before reversals. Combine with your own confluence and strategy for powerful entries.
⚠️ Reminder: Always use this tool with proper risk management — it does not guarantee entries by itself.
Zen CSC Bar Strategy v1🧠 Zen Consecutive Bar Strategy — Research Tool (Trend + Reversal)
**Description:**
This strategy is designed as a flexible research tool for studying price behavior following consecutive bull or bear bars. It allows users to explore breakout and reversal scenarios with full control over trade entry and filtering logic.
**🔧 Key Features:**
* **Configurable bar sequence**: Detects customizable streaks of consecutive bull or bear bars.
* **Trend or Reversal mode**: Toggle between breakout-style entries or fade/reversal-style setups.
* **MA-based filter**: Optionally restrict trades to occur above or below the 20-period moving average.
* Longs can be limited to above/below MA
* Shorts can be limited to above/below MA
* **Customizable R-multiple targets**: Choose between 0.5R, 1R, 1.5R, or 2R reward targets.
* **Stop loss logic**: Uses syminfo.mintick to offset stops by 1 tick beyond the pattern high/low.
* **Entry logic**: Buy/Sell either on the close of the setup bar or on breakout beyond high/low.
* **Trade direction**: Enable long-only, short-only, or both.
**📊 Research Use Only:**
This is not a ready-to-trade system. It’s intended to help traders test ideas and collect performance stats under different configurations. Use it to:
* Evaluate the failure rate of open spikes
* Study behavior following strong directional bars
* Compare trend-following vs mean-reversion edge across sessions
**❗Disclaimer:**
This script is for educational purposes only. It does not constitute financial advice. Past performance does not guarantee future results.

Advanced Range Theory - ART📊 Advanced Range Theory (ART): The Institutional Blueprint
Stop drawing lines. Start reading the blueprint of the market. Advanced Range Theory (ART) is not another support and resistance indicator; it is a military-grade market structure engine designed to decode the language of institutional capital. It operates on a single, powerful premise: markets move in phases of consolidation and expansion, and the key to anticipation lies in understanding the complete lifecycle of these phases.
ART provides a living, breathing map of the battlefield, identifying institutional accumulation zones and tracking them with unparalleled precision from their inception as "Pending" ranges to their ultimate classification after a breakout. This is your X-ray into the market's skeletal structure.
🔬 THEORETICAL FRAMEWORK: THE ARCHITECTURE OF PRICE ACTION
ART is built on a multi-layered system of logic that moves beyond static levels. It treats ranges as dynamic entities with a narrative—a beginning, a middle, and an end. The core of the system is the dynamic classification engine, which analyzes not just the range, but the character of the price action that resolves it.
1. The Range Lifecycle: From Accumulation to Classification
This is the revolutionary heart of ART. A range's true identity is only revealed by how it is broken.
Phase 1: PENDING (Yellow): A new range is identified based on a period of price consolidation (a "parent" candle followed by a minimum number of "inside" candles). At this stage, it is a neutral zone of potential energy—an area where institutions are likely building positions. It is a question the market has not yet answered.
Phase 2: MITIGATION & CLASSIFICATION: When price breaks out and reaches a calculated extension level, the range is considered "mitigated." At this exact moment, ART analyzes the breakout's DNA to classify the range's true intent:
TYPE 1 - BREAKOUT (Blue): Characterized by a strong, impulsive move with confirming volume. This is a high-conviction breakout, signaling aggressive institutional participation and the likely start of a new trend. It is a statement of intent.
TYPE 2 - REVERSAL (Orange): Occurs when price attempts to break one way but is aggressively rejected, reversing and breaking out the other side. This signals absorption and a "failed auction," often marking significant market turning points.
TYPE 3 - PIVOT (Green): A more balanced breakout, lacking the explosive momentum of a Type 1. This often represents a resolution after a period of indecision or a pivot within a larger trading range.
2. The Hierarchical Map: Source & S/R Levels
ART doesn't just draw boxes; it builds a genealogical map of market structure.
SOURCE LEVEL (Thick Gold Line): This is the "genesis" point—the most recently mitigated range. It acts as the primary point of origin for the current market swing and serves as a critical level for determining overall bias. Price action above the Source is generally bullish; below is bearish.
S/R LEVELS (Cyan Lines): When a range is mitigated, the price level where it broke becomes a key Support/Resistance zone for the future. ART tracks the two most recent S/R levels, as these often act as powerful magnets or rejection points for price.
3. The Multi-Factor Validation Engine
To eliminate noise and focus only on institutionally significant ranges, every potential range must pass a rigorous quality control check:
Time-Based Consolidation: Requires a minimum number of consecutive inside candles (minInsideCandles), ensuring a true period of balance.
Volatility-Based Significance: The range's size must be greater than a multiple of the Average True Range (minRangeSize), filtering out insignificant micro-consolidations.
Participation Confirmation: The parent candle of the range is checked against average volume to ensure there was meaningful activity during its formation.
⚙️ THE COMMAND CONSOLE: CONFIGURING YOUR ART ENGINE
Every input is designed to give you granular control over the detection engine, allowing you to tune ART to any market or timeframe with precision. Each tooltip in the script provides a deep dive, but here is a summary of the core controls.
🎯 ART Detection Engine
Minimum Inside Candles: The soul of the detection algorithm. It defines the minimum number of bars that must be contained within a single "parent" candle to qualify as a range. Higher values (3-4) find major, significant consolidation zones. Lower values (1-2) are more sensitive and will identify shorter-term accumulation patterns.
Extension Multiplier & Fibonacci Extension: These control the profit target projections. The Extension Multiplier uses a simple measured move (e.g., 1.0 = a 1:1 projection of the range's height). The Fibonacci Extension uses the golden ratio (1.618) for harmonically-derived targets.
Mitigation Method (Cross vs. Close): Determines how a breakout is confirmed. Cross is more responsive, triggering as soon as price touches the extension. Close is more conservative, requiring a full candle to close beyond the level, which helps filter out fake-outs from wicks.
Min Range Size (ATR): A crucial noise filter. It ensures that ART ignores tiny, insignificant ranges by requiring a range's height to be a certain multiple of the current market volatility (ATR).
📊 Display & Visual Configuration
These settings give you full control over the visual interface. You can toggle every single element—from the Webb Scanner to the S/R Levels—to create a clean or a comprehensive view. Choose a color theme that suits your charting environment or define a fully custom palette.
🕸️ Webb Analysis Scanner
This is a unique real-time flow analysis tool. It draws dynamic, animated lines from the current price to recent historical points. This visualization helps reveal hidden "tendrils" of momentum and short-term support/resistance that are not immediately obvious, acting as a "sonar" for immediate price flow.
📊 THE ANALYTICS HUB: YOUR DASHBOARD DECODED
The dashboard provides a real-time, at-a-glance intelligence briefing on the current state of market structure as seen by the ART engine.
RANGE METRICS: This section is a "census" of the market's structure. It tells you the total number of ranges identified, how many are still Pending (awaiting a breakout), how many are Unmitigated (active but not yet broken), and how many have been Mitigated (classified and complete).
TYPE BREAKDOWN: This is a powerful gauge of market character. A high count of Type 1 (Breakout) ranges suggests a strong, trending environment. A rising number of Type 2 (Reversal) ranges can signal market exhaustion and potential trend changes. A dominant Type 3 (Pivot) count indicates a balanced, rotational market.
KEY GUIDE: The Large dashboard includes a full legend, so you never have to guess what a line or color represents. It's your built-in user manual.
🎨 DECODING THE BLUEPRINT: A VISUAL INTERPRETATION GUIDE
Every line and color in ART is designed for instant, intuitive understanding.
The Range Lines:
Yellow Lines: A Pending range. This is an active zone of accumulation. Pay close attention.
Colored Lines (Blue/Orange/Green): An unmitigated, classified range. The color tells you its breakout character.
Dotted Lines: A Mitigated range. Its story has been told. These historical levels can still act as support or resistance.
The Identification Zones: These colored boxes appear at a range's origin point after it has been classified. They are the "birth certificate" of the range, permanently marking its type (Breakout, Reversal, or Pivot) and providing an immediate visual history of market behavior.
The Hierarchical Lines:
Thick Gold Line (Source): The most important line on your chart. It is the anchor for your bias.
Cyan Lines (S/R): High-probability decision points. Expect reactions here.
Purple Dotted Lines (Extensions): Logical, calculated profit targets for breaking ranges.
🔧 THE ARCHITECT'S VISION: THE DEVELOPMENT JOURNEY
ART was born from a deep frustration with the static and subjective nature of traditional market structure analysis. Drawing lines by hand is inconsistent, and most indicators are reactive, only confirming what has already happened. The goal was to create a proactive, objective, and dynamic framework that could think about the market in terms of phases and lifecycles.
The breakthrough came from a simple shift in perspective: a range's true character isn't defined when it forms, but by how it resolves. This led to the development of the "post-breakout classification engine," which waits for the market to show its hand before assigning a definitive type. The Webb Scanner was inspired by the desire to visualize the unseen, to create a tool that could feel the immediate "pull" and "push" of price flow. The result is not just an indicator; it is a new language for interpreting price action, built on a foundation of logic, clarity, and precision.
⚠️ RISK DISCLAIMER & BEST PRACTICES
Advanced Range Theory is a professional-grade analytical tool designed to enhance a trader's decision-making process. It does not provide direct buy or sell signals. The levels and classifications it generates are based on historical price action and mathematical probabilities. All trading involves substantial risk, and past performance is not indicative of future results. Always use this tool in conjunction with a robust risk management plan.
"I fear not the man who has practiced 10,000 kicks once, but I fear the man who has practiced one kick 10,000 times."
— Dskyz, Trade with insight. Trade with anticipation.
— Bruce Lee

Trend Continuation IndicatorTrend Continuation Indicator
The Trend Continuation Indicator is designed to assist traders in identifying potential continuation setups within established market trends. It is particularly suited for use in strong trending environments and is optimized for lower timeframes, with a recommended chart setting of 5-minute candles and an EMA timeframe set to 1 hour.
The indicator combines multiple technical elements:
RSI (Relative Strength Index): Used to assess potential overbought and oversold conditions relative to the trend.
EMA (Exponential Moving Average): A multi-timeframe EMA is used as a directional filter, helping to align entries with the broader trend.
Candle Structure and Momentum Filters: The logic includes real-time candle analysis and volume dynamics to identify momentum-driven signals.
Buy signals are generated when price action shows bullish momentum and RSI confirms potential oversold conditions within an uptrend. Conversely, sell signals are triggered when bearish momentum aligns with overbought RSI levels in a downtrend.
This tool is intended for use as part of a broader trading strategy and is best applied in trending markets where continuation patterns are more likely to follow through.
THE INDICATOR ITSELF IS NO FINANCIAL ADVISE!
Here are some usecase examples:

SOL Smart Alert SystemITECS built this to work alongside my AI agent and scripts to provide a robust notification/alert system that can be configured to best work with the current market conditions.

SOL Elliott Wave 4H with Enhanced ProjectionsThis 4H-optimized version includes:
Key Features for 4H Timeframe:
Optimized Default Settings:
Wave Detection Period: 7 (perfect for 4H)
ZigZag Depth: 3% (captures significant moves on 4H)
Visual Indicators:
Small circles mark pivot points as they form
Blue background on the last bar shows script is active
Clean zigzag lines between pivots
Wave numbers at each pivot
Immediate Feedback:
Pivots show up as soon as they're confirmed
Table shows pivots found count
Current price always visible
To Use This:
Add to your 4H SOL chart
You should immediately see:
Small circles marking recent pivots
The info table in top-right
Blue highlight on the current bar
If you don't see lines yet, try:
Reduce Wave Detection Period to 5
Reduce ZigZag Depth to 2%
Make sure you have at least 100-200 bars of history loaded
Fine-tuning for current market:
If SOL is ranging: Lower ZigZag Depth to 2%
If SOL is trending strongly: Increase to 4-5%
The indicator will start drawing zigzag lines and counting waves as soon as it finds valid alternating highs and lows that meet the minimum percentage move requirement.

DA Cloud - DynamicDA Cloud - Dynamic | Detailed Overview
🌟 What Makes This Indicator Special
The DA Cloud - Dynamic is an advanced technical analysis tool that creates adaptive support and resistance zones that expand and contract based on market volatility. Unlike traditional static indicators, this cloud system "breathes" with the market, providing dynamic levels that adjust to changing market conditions.
📊 Core Components
1. Multi-Layered Cloud Structure
Resistance Cloud (Red): Three dynamic resistance levels (RL1, RL2, RL3) with intermediate channels (RC1, RC2)
Support Cloud (Green): Three dynamic support levels (SL1, SL2, SL3) with intermediate channels (SC1, SC2)
Trend Cloud (Blue): Five trend lines (TU2, TU1, TM, TL1, TL2) that flow through the center
Confirmation Line (Purple): A fast-reacting line that confirms trend changes
2. Forward Displacement Technology
The entire cloud system is projected 21 bars into the future (Fibonacci number), allowing traders to see potential support and resistance levels before price reaches them. This predictive element is inspired by Ichimoku Cloud theory but enhanced with modern volatility dynamics.
🔬 How It Works (Without Revealing the Secret Sauce)
Volatility-Responsive Design
The indicator continuously measures market volatility across multiple timeframes
During high volatility periods (like major breakouts), clouds expand dramatically
During consolidation, clouds contract and tighten around price
This creates a "breathing" effect that adapts to market conditions
Multi-Timeframe Analysis
Incorporates Fibonacci sequence periods (3, 13, 21, 34, 55) for calculations
Blends short-term responsiveness with long-term stability
Creates smooth, flowing lines that filter out market noise
Dynamic Level Calculation
Levels are not fixed percentages or static bands
Each level adapts based on current market structure and volatility
Channel lines (RC1, RC2, SC1, SC2) provide intermediate support/resistance
🎯 Key Features
1. Touch Point Detection
Colored dots appear when price touches key levels
Red dots = resistance touch
Green dots = support touch
Blue dots = trend median touch
2. Entry/Exit Signals
"Cloud Entry" labels when confirmation line crosses above SL1
"Cloud Exit" labels when confirmation line crosses below RL1
Background color changes based on bullish/bearish bias
3. Information Table
Real-time display of key levels (RL1, TM, SL1)
Current bias indicator (BULLISH/BEARISH)
Updates dynamically as market moves
⚙️ Customization Options
Main Controls:
Sensitivity (5-50): How responsive clouds are to price movements
Smoothing (1-50): Controls the flow and smoothness of cloud lines
Forward Displacement (0-50): How many bars to project the cloud forward
Advanced Volatility Settings:
Volatility Lookback (50-1000): Period for establishing volatility baseline
Volatility Smoothing (1-50): Reduces spikes in volatility expansion
Expansion Power (0.1-2.0): Controls how dramatically clouds expand
Range Divisor (1.0-20.0): Master control for overall cloud width
Level Spacing:
Individual multipliers for each resistance and support level
Allows fine-tuning of cloud structure to match different markets
Trend Spacing:
Separate controls for inner and outer trend bands
Customize the trend cloud density
📈 Trading Applications
1. Trend Identification
Price above TM (Trend Median) = Bullish bias
Price below TM = Bearish bias
Cloud color and width indicate trend strength
2. Support/Resistance Trading
Use RL1/SL1 as primary targets and reversal zones
RC1/RC2 and SC1/SC2 provide intermediate levels
RL3/SL3 mark extreme levels often seen at major tops/bottoms
3. Volatility Analysis
Expanding clouds signal increasing volatility and potential big moves
Contracting clouds indicate consolidation and potential breakout setup
Cloud width helps with position sizing and risk management
4. Multi-Timeframe Confirmation
Works on all timeframes from 1-minute to monthly
Higher timeframes show major market structure
Lower timeframes provide precise entry/exit points
🎓 Best Practices
Combine with Volume: High volume at cloud levels increases reliability
Watch for Touch Clusters: Multiple touches at a level indicate strength
Monitor Cloud Expansion: Sudden expansion often precedes major moves
Use Multiple Timeframes: Confirm signals across different time periods
Respect the Trend Median: This is often the most important level
⚡ Performance Notes
Optimized for up to 2000 bars of historical data
Smooth performance with 500+ lines and labels
Works on all markets: Crypto, Forex, Stocks, Commodities
📝 Version Info
Current Version: 1.0
Dynamic volatility expansion system
Full customization suite
Touch point detection
Entry/exit signals
Forward displacement projection

Asian Session + Break & Retest Helperbrake and retest helper, it helps to see what levels are goin to break to the up or downside etc.

SOL Technical Confluence DashboardHow to Use This Confluence Dashboard
Setup Instructions:
Use the other script published as the 1 of 2 scripts to add to your 4-hour SOL chart.
What You'll See:
1. RSI Panel with Enhancements
Colored RSI line (Green = oversold, Red = overbought)
Divergence detection (triangles mark divergences)
Background color changes on strong signals
2. Confluence Table (Top Right)
Shows real-time status of:
RSI: Current value and signal
MACD: Trend direction
Volume: Spike detection and relative volume
Divergence: Bull/Bear divergence alerts
Confluence Scores: 0-10 scale for bull/bear strength
Overall Signal: STRONG BUY/SELL, BUY/SELL, or WAIT
3. Net Confluence Histogram (Bottom)
Green bars = Bullish confluence
Red bars = Bearish confluence
Height = Strength of signal
How It Works with Elliott Waves:
Scenario 1: Wave 5 Top Detection
Elliott Wave shows Wave 5 approaching 261.8%
Confluence Dashboard shows:
RSI: 78 (overbought) ❌
MACD: Bearish cross ❌
Volume: Declining ❌
Divergence: Bearish ❌
Signal: STRONG SELL 🔴
Scenario 2: Wave 2 Bottom
Elliott Wave shows Wave 2 at 61.8% retracement
Confluence Dashboard shows:
RSI: 28 (oversold) ✅
MACD: Bullish cross ✅
Volume: Spike ✅
Divergence: Bullish ✅
Signal: STRONG BUY 🟢
Confluence Scoring System:
The script uses a weighted scoring system:
Divergences: 3 points (most reliable)
RSI extremes: 2 points
Volume spikes: 2 points
MACD signals: 1.5 points
Price action: 1 point
Signals:
Score ≥ 5 = STRONG signal
Score ≥ 3 = Moderate signal
Score < 3 = WAIT
Pro Tips for Maximum Accuracy:
Best Setups: When Elliott Wave completion aligns with STRONG signals
Avoid: Taking trades when confluence is mixed
Volume Confirmation: Always check if volume supports the move
Divergence Priority: RSI divergence at wave endpoints is highly reliable
Alerts Available:
Strong Bullish Confluence
Strong Bearish Confluence
Bullish Divergence
Bearish Divergence
This gives you a complete technical analysis suite that works seamlessly with your Elliott Wave indicator. The combination significantly improves accuracy by confirming wave counts with momentum, volume, and divergence analysis!

RLMC TMAS ALPHABOT by SAMOEDEFIferas gang
made by samoedefi
for rlmcrew
ict concepts with bos breaks

Support & Resistance ZonesAuto Support And Resistance Lines, This AI auto support and ressitance lines helps identify support and resitance


Heikin Ashi Trend Strategy (Beginner)FOR BEGINNERS
Perfect! Below is a custom Pine Script for TradingView that:
Uses Heikin Ashi candles
Shows buy/sell signals based on trend conditions:
3+ green/red Heikin Ashi candles
Price above/below 20 EMA
RSI filter for momentum

Gold & FX 4H StrategyWith this indicator you BUY when the price is ABOVE the EMA and SELL when price is BELLOW all the EMA

N-Pattern Detector (Advanced Logic)Introduction
The N-Pattern Detector (Advanced Logic) is a powerful Pine Script-based tool designed to identify a specific price structure known as the "N-pattern", which often indicates trend continuation or potential breakout points in the market. This pattern combines zigzag pivot logic, retracement filters, volume confirmation, and trend alignment, offering high-probability trading signals.
It is ideal for traders who want to automate pattern detection while applying smart filters to reduce false signals in various markets — including stocks, forex, crypto, and indices.
What is the N-Pattern?
The N-pattern is a 3-leg price formation consisting of points A-B-C-D. It typically follows this structure:
Bullish N-Pattern:
A → Low Pivot
B → Higher High (Impulse)
C → Higher Low (Retracement)
D → Breakout above B (Confirmation)
Bearish N-Pattern:
A → High Pivot
B → Lower Low (Impulse)
C → Lower High (Retracement)
D → Breakdown below B (Confirmation)
The pattern essentially reflects a trend–pullback–breakout structure, making it suitable for continuation trades.
Key Features
1. Intelligent ZigZag Pivot Detection
Uses pivot highs/lows to define key swing points (A, B, C).
Adjustable ZigZag depth to control pattern sensitivity.
Filters noise and avoids false signals in volatile markets.
2. Retracement Validation
Validates the B→C leg as a proper pullback using Fibonacci-based thresholds.
User-defined min and max retracement settings (e.g., 38.2% to 78.6% of A→B leg).
3. Trend Filter via EMA
Filters patterns based on trend direction using a customizable EMA (e.g., 200 EMA).
Only detects bullish patterns above EMA and bearish patterns below EMA (optional).
4. Volume Confirmation
Ensures that impulse legs (A→B, C→D) are supported by stronger volume than the correction leg (B→C).
Adds another layer of confirmation and reliability to detected patterns.
5. Target Projections
Automatically draws 100% A→B projected target from point C.
Optional Fibonacci extensions at 1.272 and 1.618 levels for take-profit planning.
Visually plotted on the chart with colored dashed/dotted lines.
6. Clear Visuals & Labels
Connects all pattern points with colored lines.
Clearly labels points A, B, C, D on the chart.
Uses customizable colors for bullish and bearish patterns.
Includes real-time alerts when a valid pattern is detected.
How to Use It
Add to Chart
Apply the indicator to any chart and time frame. It works across all asset classes.
Adjust Inputs (Optional)
Set ZigZag Depth to control pivot detection sensitivity.
Define Min/Max Retracement levels to match your trading style.
Enable or disable Trend and Volume filters for cleaner signals.
Customize EMA length (default: 200) for trend validation.
Wait for Pattern Confirmation
The indicator constantly scans for valid N-patterns.
A pattern is confirmed only after point D forms (breakout or breakdown).
You’ll see the full pattern drawn with target levels.
Set Alerts
Alerts trigger automatically on confirmation of a bullish or bearish pattern.
You can customize these in TradingView’s alerts panel.

ATR % Line from Day LowThis places a line at a determined percent distance (within the settings panel) from the high or low of the day to make sure you're not buying extended.


PM + BOS + FVG Indicator & AlertsHey team it's Tanner, I have created Nitros strategy into a custom indicator, it's only the PM BOS FVG model, I will add a HOD/LOD BOS FVG custom indicator eventually, this indicator is setup to give you alerts as well. or if you just want a clean FVG indicator and or PM level indicator this works too. mess with the settings to your liking and DM me on circle or discord if you have feedback or questions, thanks team.
