OPEN-SOURCE SCRIPT
STY-Divergence
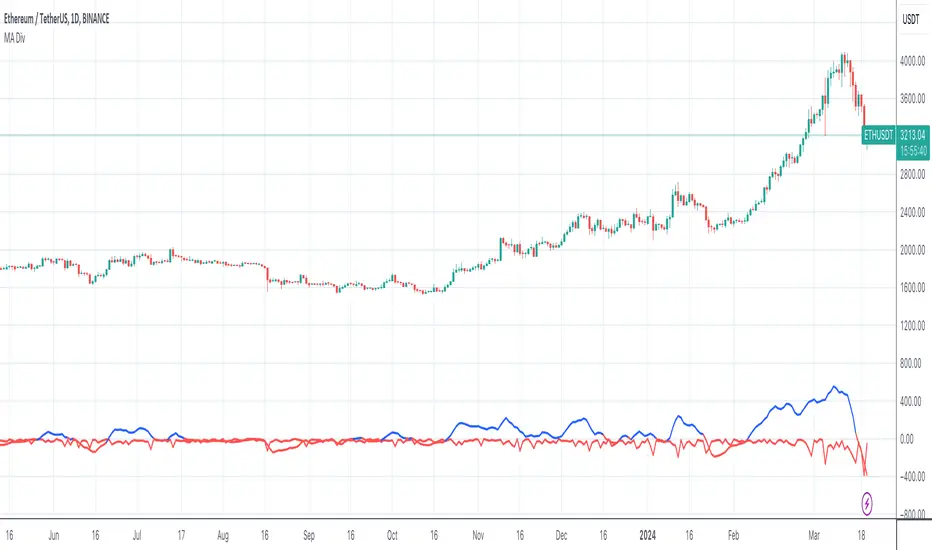
draws a blue line representing the divergence between a 3-period moving average (3MA) close and the current candle high, and a red line representing the divergence between a 20-period moving average (20MA) close and the 3MA close
This script calculates the moving averages for both 3-period and 20-period and then computes the divergences as described. It plots the lines with blue color if the divergence is positive and red if negative. Adjust the length of moving averages or other parameters according to your preference.
This script calculates the moving averages for both 3-period and 20-period and then computes the divergences as described. It plots the lines with blue color if the divergence is positive and red if negative. Adjust the length of moving averages or other parameters according to your preference.
Skrip sumber terbuka
Dalam semangat TradingView sebenar, pencipta skrip ini telah menjadikannya sumber terbuka, jadi pedagang boleh menilai dan mengesahkan kefungsiannya. Terima kasih kepada penulis! Walaupuan anda boleh menggunakan secara percuma, ingat bahawa penerbitan semula kod ini tertakluk kepada Peraturan Dalaman.
Penafian
Maklumat dan penerbitan adalah tidak bertujuan, dan tidak membentuk, nasihat atau cadangan kewangan, pelaburan, dagangan atau jenis lain yang diberikan atau disahkan oleh TradingView. Baca lebih dalam Terma Penggunaan.