PROTECTED SOURCE SCRIPT
Telah dikemas kini Smart Trend Lines [The_lurker]
"Smart Trend Lines" هو مؤشر متقدم مصمم لرسم خطوط الاتجاه الديناميكية تلقائيًا على الرسم البياني، مع القدرة على اكتشاف الكسور (Breakouts) بدقة باستخدام فلاتر تحليلية مثل ADX، RSI، والحجم. يوفر المؤشر ثلاثة أنواع من خطوط الاتجاه – رئيسية (Main)، متوسطة (Mid)، وقصيرة (Short) – لتلبية احتياجات المتداولين على مختلف الأطر الزمنية، سواء كانوا يركزون على الاتجاهات طويلة الأمد أو قصيرة الأمد.
كيف يعمل :
1- رسم خطوط الاتجاه:
يستخدم المؤشر نقاط الـ Pivot Highs و Pivot Lows لتحديد خطوط الاتجاه الصاعدة والهابطة تلقائيًا.
يتم رسم ثلاثة مستويات لخطوط الاتجاه بناءً على أطوال زمنية قابلة للتخصيص:
Main Trend Lines: لتحليل الاتجاهات طويلة الأمد (افتراضي: 50 شمعة).
Mid Trend Lines: للاتجاهات متوسطة المدى (افتراضي: 21 شمعة).
Short Trend Lines: للاتجاهات قصيرة المدى (افتراضي: 9 شموع).
2- اكتشاف الكسور:
يتم اكتشاف كسر خط الاتجاه عندما يتجاوز السعر (إغلاق، أعلى، أدنى - حسب اختيار المستخدم) الخط.
يتم وضع تسمية (Label) عند نقطة الكسر تحمل معلومات مختصرة عن الشروط المتحققة (مثل الحجم، ADX، RSI).
3- فلاتر التحقق:
ADX: يتحقق من قوة الاتجاه (الحد الأدنى قابل للتعديل، افتراضي: 20).
RSI: يستخدم لتصفية الكسور في مناطق التشبع الشرائي أو البيعي (حدود عليا وسفلى قابلة للتخصيص).
Volume: يقارن الحجم الحالي بالمتوسط المتحرك للحجم للتأكد من قوة الحركة.
4- التنبيهات:
يوفر تنبيهًا موحدًا عند حدوث أي كسر (شراء أو بيع) لجميع أنواع الخطوط، مع إطلاق التنبيه فقط عند شمعة الكسر.
المميزات الرئيسية
خطوط اتجاه متعددة المستويات:
ثلاثة أطوال مختلفة (رئيسية، متوسطة، قصيرة) مع إمكانية إظهارها أو إخفائها بشكل مستقل، مما يتيح المرونة للمتداولين.
تخصيص كامل:
تعديل أطوال خطوط الاتجاه (عدد الشموع).
اختيار الألوان والأنماط (متصل، متقطع، منقط) لكل نوع من الخطوط.
تحديد حجم التسميات (Tiny, Small, Normal, Large, Huge).
اختيار نوع السعر المستخدم لفحص الكسر (Close, High, Low).
فلاتر ذكية:
استخدام ADX لتأكيد قوة الاتجاه.
فلتر RSI لتجنب الإشارات في المناطق المشبعة.
مقارنة الحجم لضمان أهمية الكسر.
تسميات تفاعلية:
تظهر التسميات عند الكسر مع رموز مختصرة (V للحجم، A لـ ADX، R لـ RSI) لتوضيح الشروط المتحققة.
حجم التسميات قابل للتخصيص لتحسين الرؤية.
تنبيهات دقيقة:
تنبيه واحد موحد لجميع الكسور (شراء أو بيع) يُطلق فقط عند شمعة الكسر، مما يقلل من الإزعاج ويزيد من الكفاءة.
عرض الخطوط السابقة:
خيار اختياري لعرض خطوط الاتجاه الرئيسية السابقة لتحليل تاريخي أعمق.
الفوائد
سهولة الاستخدام: يرسم خطوط الاتجاه تلقائيًا دون الحاجة إلى رسم يدوي.
دقة عالية: الفلاتر المتعددة (ADX، RSI، Volume) تقلل من الإشارات الخاطئة وتعزز موثوقية الكسور.
مرونة كبيرة: مناسب لجميع أنواع المتداولين (Scalpers، Swing Traders، Long-term Investors) بفضل الخطوط متعددة الأطوال.
واجهة مرئية واضحة: ألوان وأنماط قابلة للتخصيص تجعل الرسم البياني سهل القراءة.
%% نصائح الاستخدام
للمتداولين قصيري الأمد: ركز على خطوط "Short" واضبط الفلاتر لتكون أكثر حساسية (مثل تقليل عتبة ADX).
للتحليل طويل الأمد: استخدم خطوط "Main" مع إعدادات افتراضية أو أطول لالتقاط الاتجاهات الكبيرة.
قم بتفعيل التنبيهات للحصول على إشعارات فورية عند حدوث كسر مؤكد.
%% الإعدادات
Main/Mid/Short Trend Line Length: اضبط طول كل خط بناءً على استراتيجيتك.
Color & Style: اختر ألوانًا وأنماطًا تناسب تفضيلاتك البصرية.
Break Check Price: حدد نوع السعر المستخدم للكسر (افتراضي: Close).
Label Size: اختر حجم التسميات حسب احتياجاتك.
Filters: فعّل أو عطّل الفلاتر وضبط العتبات (ADX، RSI، Volume) لتتناسب مع السوق.
إخلاء المسؤولية
لا يُقصد بالمعلومات والمنشورات أن تكون، أو تشكل، أي نصيحة مالية أو استثمارية أو تجارية أو أنواع أخرى من النصائح أو التوصيات المقدمة أو المعتمدة من TradingView.
"Smart Trend Lines" is an advanced indicator for drawing dynamic trend lines, with the ability to detect breakouts (breakouts) using analytical filters such as ADX, RSI, etc. It provides three types of light lines - main (main), intermediate (intermediate), and short (short) - for the General Pipeline Network Company on various time frames, whether they are set on long-term or precious trends.
How it works:
1- Drawing lines for lines:
Uses the Pivot Highs and Pivot Lows indicator points for guide lines and automatic guide lines.
Three levels of guide lines are drawn along the air lines for customization:
Main trend lines: for analyzing long-term trends (default: 50 candles).
Intermediate trend lines: for medium-term trends (default: 21 candles).
Short trend lines: for short-term trends (default: 9 candles).
2- Fracture detection:
A fault is detected when the price (close, high, low - according to the user's choice) crosses the line.
A label is placed at the break point with brief information about the conditions met (such as volume, ADX, RSI).
3- Validation filters:
ADX: Checks the strength of the fault (simple limit, default: 20).
Relative Strength Index (RSI): Used to filter out fractures in the northern or eastern regions (customizable upper limits).
Volume: Compares the current volume to the moving average of the volume by the strength of the impact.
4- Alerts:
Provides a unified alert when any break (buy or sell) occurs for all types of lines, with the alert being triggered only when the break occurs.
Key features
Multiple trend lines for levels:
Three different lengths (main, medium, short) with the possibility of showing or hiding them independently, allowing traders.
Full translation:
Modify the length of the lines (number of candles).
Choose colors and styles (solid, dashed, dotted) for each type of line.
Select label size (small, small, normal, large, huge).
Select user type to check the breakout (close, high, low).
Smart filters:
Use ADX to confirm the strength of the error.
RSI filter abbreviated in environmental factors.
Compare volume and use of the breakout.
Interactive labels:
Scale labels on the breakout with special symbols (V for volume, A for ADX, R for RSI) to indicate the conditions met.
Customizable label size to customize the search.
Precise alerts:
A single unified alert for all breakouts (buy or sell) is triggered only on the breakout, choosing from celebration to protest for that.
View previous lines:
Option to select previous major lines to analyze their history.
Benefits
Ease of use: Draws freehand lines without the need to draw by hand.
High-precision: Optical filters (ADX, RSI, Volume) are effective from the effective impact and enhance the confidence of the breakouts.
Multiple options: Suitable for all types of traders (scalpers, swing traders, long-term investors) thanks to Malaysia Airlines 24/7.
Visual interface: Colors and patterns can be plotted for easy-to-read charting.
%% Tips for use
For short-term traders: Focus on the "short" lines and adjust the filters to be more visible (e.g. reduce the ADX bar).
For long-term analysis: Use the "main" lines with default or partial settings for key points.
Enable notifications for breakouts on instant notifications when absolutely necessary.
%%Except
Main/Intermediate/Short Trend Line Length: Adjust the length of each line to guide you.
Color and Style: Choose colors and styles to suit your visual preferences.
Verify Price Breakout: Select the type of price used for the breakout (default: Close).
Label Size: Choose the size of the labels as desired.
Filters: Enable or disable filters and adjust thresholds (ADX, RSI, Volume) to suit the market.
Disclaimer
The information and posts are not intended to be, or constitute, any financial, investment, trading or other types of preparation or execution of tasks or endorsed by TradingView.
Nota Keluaran
تم اصلاح التنبيهThe alert has been fixed.
Nota Keluaran
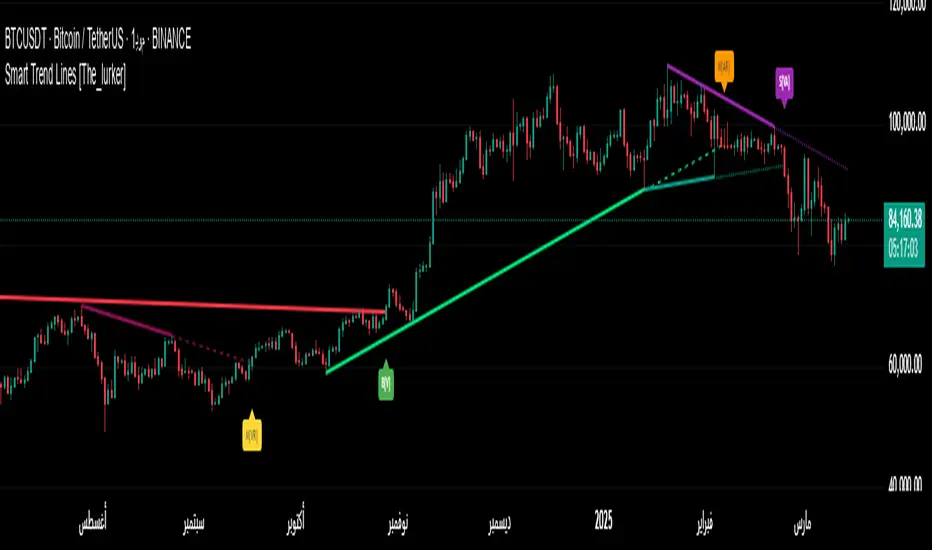
**"Smart Trend Lines" is an advanced indicator that automatically plots dynamic trend lines and detects breakouts with precision using filters like ADX, RSI, and volume. It offers three trend line types—Main, Mid, and Short—to suit long-term, medium-term, and short-term trading strategies, simplifying trend analysis and reducing false signals.**---
### **How It Works:**
#### **1- Plotting Trend Lines:**
The indicator uses Pivot points (highs and lows where price direction changes) to plot bullish and bearish trend lines. A trend line is drawn between two consecutive Pivot points and extended dynamically to track price action.
- **Three Levels**:
- **Main**: For long-term trends (default: 50 candles).
- **Mid**: For medium-term trends (default: 21 candles).
- **Short**: For short-term trends (default: 9 candles).
This multi-level approach allows trend analysis across different time scales on the same chart.
#### **2- Detecting Breakouts:**
A breakout occurs when the price crosses a trend line in the opposite direction (e.g., above a bearish line or below a bullish line). Labels at breakout points show met conditions, e.g., "B[VAR]" indicates a Main trend line breakout confirmed by Volume (V), ADX (A), and RSI (R).
- **Price Type**: Choose Close, High, or Low for breakout detection, balancing sensitivity and conservatism.
#### **3- Verification Filters:**
To reduce false signals, three filters are used:
- **ADX**: Confirms trend strength (default threshold: 20). High ADX values indicate strong trends, filtering out weak breakouts.
- **RSI**: Avoids signals in overbought (>65) or oversold (<35) zones, reducing reversal risks.
- **Volume**: Ensures breakouts are backed by significant trading activity, comparing current volume to a moving average (default: 20 candles) and prior candles.
#### **4- Alerts:**
Unified alerts trigger only at breakout candle close, minimizing noise. Set up via TradingView’s alert system by selecting "Any alert() function call."
---
### **What Makes This Indicator Unique:**
- **Multi-Dimensional Integration**: Combines trend line analysis with ADX, RSI, and volume filters for comprehensive market insights.
- **Flexible Trend Analysis**: Three trend line lengths enable multi-timeframe analysis on one chart, unlike single-length indicators.
- **Smart Filtering**: Customizable filters reduce false signals, with interactive labels (e.g., "B[VA]") showing filter confirmation, enhancing decision-making.
---
### **Key Features:**
- **Multi-Level Trend Lines**: Main, Mid, Short, with show/hide options.
- **Customization**: Adjust lengths, colors, styles, label sizes, and price type (Close, High, Low).
- **Smart Filters**: ADX, RSI, and volume filtering.
- **Interactive Labels**: Display met conditions (V, A, R) at breakouts.
- **Alerts**: Unified, triggered at candle close.
- **Historical Lines**: Optional display of past Main trend lines.
- **Strategy Integration**: Use with support/resistance, MACD, or Bollinger Bands for enhanced signals.
---
### **Benefits:**
- **Ease of Use**: Automates trend line plotting.
- **Accuracy**: Filters reduce false signals.
- **Flexibility**: Suits scalpers, swing traders, and investors.
- **Clarity**: Customizable visuals improve readability.
- **Efficiency**: Saves time on manual analysis.
---
### **Usage Tips:**
- **Scalpers**: Use "Short" lines, lower ADX to 15, disable RSI in volatile markets (e.g., EUR/USD on M5 during European session).
- **Swing Traders/Investors**: Use "Main" lines, raise ADX to 25 for strong trends (e.g., S&P 500 on D1 for major trend shifts).
- **Alerts**: Enable for instant notifications, disable during low-volume sessions (e.g., Asian session).
- **Risk Management**: Use stop-loss orders (e.g., below prior candle low on GBP/USD H1 breakout).
- **Testing**: Test on a demo account or TradingView’s Strategy Tester (e.g., EUR/USD H1 in ranging markets).
---
### **Settings:**
- **Trend Line Length**: E.g., 50 for Main on D1, 9 for Short on H1.
- **Color & Style**: Use bold colors for Main, lighter for Mid/Short.
- **Break Check Price**: Close for conservative signals, High/Low for sensitivity.
- **Label Size**: Large/Huge on higher timeframes, Small/Tiny on lower.
- **Filters**: E.g., raise ADX to 25, disable RSI in trending markets; lower ADX to 15, enable RSI in ranging markets.
---
### **Disclaimer:**
This information is not financial, investment, trading, or other advice or recommendations provided or endorsed by TradingView. Test the indicator in a demo environment and conduct your own analysis before live trading.
---
### **Key Changes in the Shortened Version**
1. **Reduced Length**: Removed redundant explanations while retaining all essential points, making the description more concise and readable.
2. **Maintained Compliance**: Ensured the description meets the moderators’ requirements by clarifying core concepts, highlighting uniqueness, and providing practical examples.
3. **Improved Organization**: Used bullet points and shorter paragraphs for better readability, especially for users scanning the text.
4. **Practical Examples**: Kept concise examples to illustrate usage without overwhelming the reader.
Skrip dilindungi
Skrip ini diterbitkan sebagai sumber tertutup. Akan tetapi, anda boleh menggunakannya secara bebas dan tanpa apa-apa had – ketahui lebih di sini.
Penafian
Maklumat dan penerbitan adalah tidak bertujuan, dan tidak membentuk, nasihat atau cadangan kewangan, pelaburan, dagangan atau jenis lain yang diberikan atau disahkan oleh TradingView. Baca lebih dalam Terma Penggunaan.