OPEN-SOURCE SCRIPT
Telah dikemas kini [blackcat] L1 Buy After Retracement
Level 1
Background
A summary of Buy After Retracement Entry Points.
Function
The "retraction to the moving average buying method", as the name suggests, is a buying reference for short-term adjustment and retracement to the key moving average after a single stock rises. For example, after the index has undergone a sharp correction, many strong stock varieties have retreated or are about to retreat to the key moving average position, and the buying point generated at this time is the "retraction to moving average buying method". Because candlesticks and moving averages have different styles, I summarize what I think of through this script.
Remarks
Feedbacks are appreciated.
Nota Keluaran
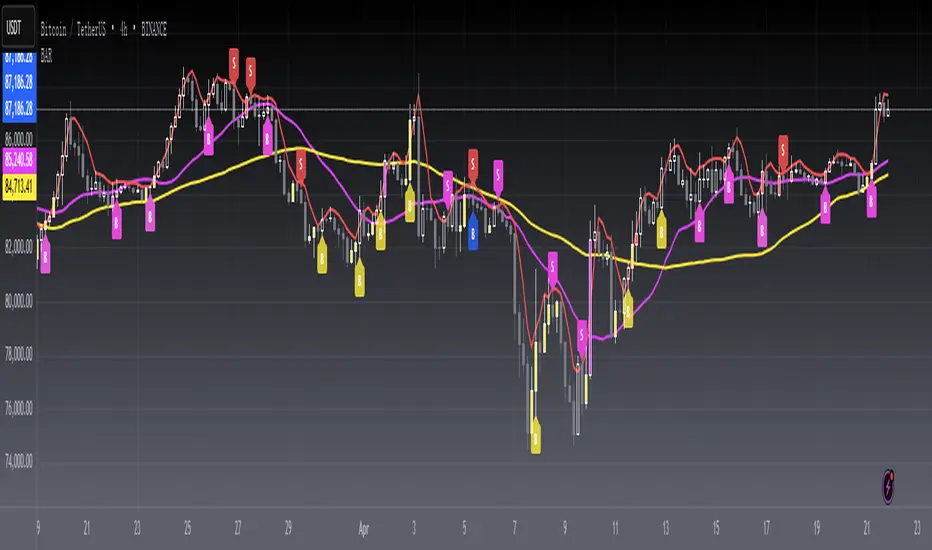
OVERVIEWThe [blackcat] L1 Buy After Retracement indicator is designed to identify potential buying opportunities after price retracements. This script uses a combination of moving averages, EMAs, and custom conditions to generate buy signals based on specific market patterns. The indicator plots clear labels on the chart for easy visualization of these signals 📈💹.
FEATURES
Utilizes multiple moving averages:
Short-term MA: Simple Moving Average with length 22.
Medium-term MA: Simple Moving Average with length 21.
Long-term MA: Simple Moving Average with length 60.
EMAs: Exponential Moving Averages derived from closing prices.
Plots various lines on the chart for reference:
Short-term MA: Fuchsia line.
Long-term MA: Yellow line.
Lowest High: Red line.
Generates buy ('B') and sell ('S') labels based on complex conditions:
Labels are plotted at significant points indicating potential trade entries.
Different colors represent different signal types for better differentiation.
Customizable parameters allow users to fine-tune the sensitivity of the indicator ⚙️
HOW TO USE
Add the indicator to your TradingView chart by selecting it from the indicators list.
Observe the plotted buy ('B') and sell ('S') labels on the chart.
Use the generated signals as potential entry points for trades.
Combine this indicator with other forms of analysis for more reliable trading decisions.
LIMITATIONS
The indicator may generate false signals in highly volatile or ranging markets 🌪️.
Users should test the indicator thoroughly before applying it to live trading.
The effectiveness of the indicator may vary depending on the asset and timeframe being analyzed.
NOTES
Ensure that you have sufficient historical data available for accurate calculations.
Test the indicator thoroughly on demo accounts before applying it to live trading 🔍.
Customize the appearance and parameters as needed to fit your trading strategy.
Skrip sumber terbuka
Dalam semangat TradingView sebenar, pencipta skrip ini telah menjadikannya sumber terbuka, jadi pedagang boleh menilai dan mengesahkan kefungsiannya. Terima kasih kepada penulis! Walaupuan anda boleh menggunakan secara percuma, ingat bahawa penerbitan semula kod ini tertakluk kepada Peraturan Dalaman.
Avoid losing contact!Don't miss out! The first and most important thing to do is to join my Discord chat now! Click here to start your adventure: discord.com/invite/ZTGpQJq 防止失联,请立即行动,加入本猫聊天群: discord.com/invite/ZTGpQJq
Penafian
Maklumat dan penerbitan adalah tidak bertujuan, dan tidak membentuk, nasihat atau cadangan kewangan, pelaburan, dagangan atau jenis lain yang diberikan atau disahkan oleh TradingView. Baca lebih dalam Terma Penggunaan.