PROTECTED SOURCE SCRIPT
𝙷✪𝚕𝚍𝚎𝚖 [Enhanced MULTI MA Dashboard v7.2]
𝙷✪𝚕𝚍𝚎𝚖 — Enhanced MULTI MA Dashboard v7.2
What it does
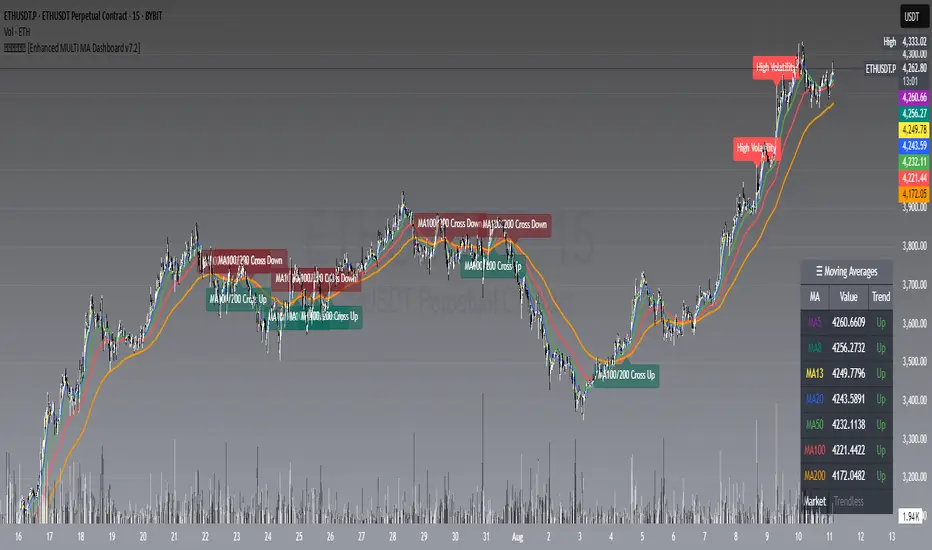
A complete moving-average control center that overlays up to seven MAs (5/8/13/20/50/100/200), draws dynamic MA clouds between consecutive pairs, tags crossover events (optional), and shows a compact on-chart dashboard with each MA’s current value and slope-based trend (Up/Down/Flat). It also detects Trendless and High-Volatility regimes to help you adapt your strategy.
Key Features
7 Configurable Moving Averages
- Turn each MA on/off individually (5, 8, 13, 20, 50, 100, 200).
- Choose type per MA: SMA, EMA, WMA, HMA, VWMA.
- Set lengths freely and color each line.
- Works on any symbol and timeframe; source selectable (close/open/high/low, etc.).
☁︎ MA Clouds (optional)
- Shaded cloud between each consecutive pair (5–8, 8–13, 13–20, 20–50, 50–100, 100–200).
- Cloud auto-colors toward the currently dominant MA (above/below) with adjustable transparency.
- Quick visual read of short- vs long-side control and compression/expansion.
⚠️ Market Regime Detection
- Trendless: measures how tightly short MAs (5, 8, 13) are clustered using std-dev % of their values; user-set threshold.
- High Volatility: flags when ATR(Length) > ATR SMA × Multiplier.
- Optional background tint and chart labels when regimes flip.
- Dashboard cell shows Trending / Trendless / High Volatility with color coding.
➕ Crossover Signal Labels (fully granular)
- Toggle labels for any pair you care about (e.g., 5/8, 8/20, 50/200, etc.).
- Separate styles/colors for Cross Up and Cross Down; adjustable label size.
- Great for momentum shifts, golden/death cross style monitoring, or timing add/reduce decisions.
- (Note: these are visual labels; no alertconditions are defined.)
📊 On-Chart MA Dashboard
- Compact, movable table (Top/Bottom/Middle, Left/Right/Center).
- Columns: MA name, current value, trend direction (derived from MA slope).
- Customizable text size, header text, colors, background, optional alternating row colors, and border styling.
- Auto-adds a Market row when regime detection is enabled.
How to Use
1 Pick your data source (close by default) and switch on the MAs you care about.
2 Choose MA types and lengths to match your system (e.g., EMA for reactivity, SMA for smoothing).
3 Enable MA Clouds to see compression/expansion and dominance at a glance.
4 Set regime thresholds:
- Lower Trendless Threshold → stricter definition of chop.
- Raise ATR Multiplier → fewer, “truer” high-volatility flags.
5 Activate specific crossovers that fit your playbook (e.g., 5/20 for short-term momentum, 50/200 for cycle turns).
6 Position and style the dashboard so it stays readable on your layout.
Signal & Reading Guide
- Trend column (Up/Down/Flat) reflects the slope of each MA (today vs previous bar).
- Cloud flips (color dominance changes) often precede or confirm crossover labels.
- Trendless suggests range conditions; consider mean-reversion tools or stand aside.
- High Volatility calls for wider stops or volatility-aware sizing; breakouts can travel farther.
Disclaimer
This tool is for education and visualization. It does not constitute financial advice and is not a buy/sell system by itself. Always validate signals within your broader risk-managed plan.
Skrip dilindungi
Skrip ini diterbitkan sebagai sumber tertutup. Akan tetapi, anda boleh menggunakannya secara bebas dan tanpa apa-apa had – ketahui lebih di sini.
𝙷✪𝚕𝚍𝚎m
Penafian
Maklumat dan penerbitan adalah tidak bertujuan, dan tidak membentuk, nasihat atau cadangan kewangan, pelaburan, dagangan atau jenis lain yang diberikan atau disahkan oleh TradingView. Baca lebih dalam Terma Penggunaan.