OPEN-SOURCE SCRIPT
Telah dikemas kini Dual Bayesian For Loop [QuantAlgo]

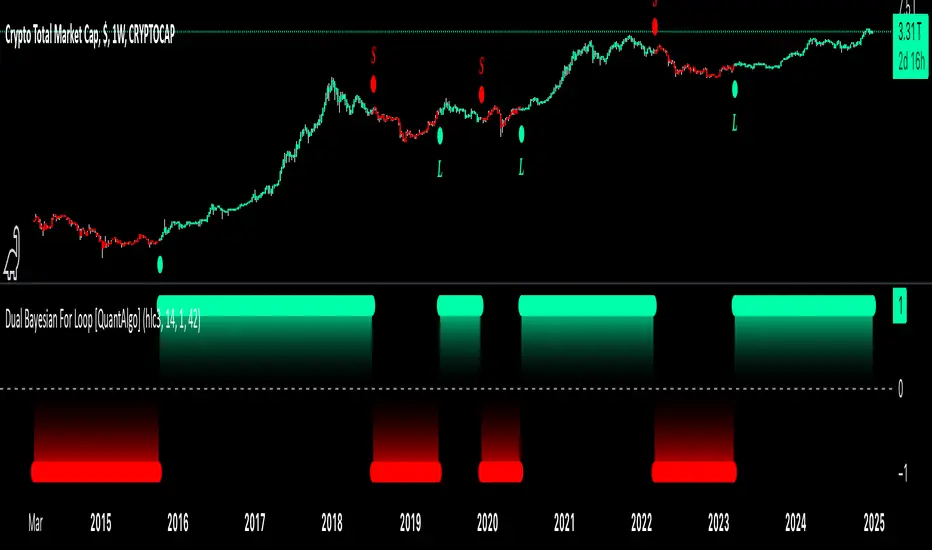
Discover the power of probabilistic investing and trading with Dual Bayesian For Loop by QuantAlgo, a cutting-edge technical indicator that brings statistical rigor to trend analysis. By merging advanced Bayesian statistics with adaptive market scanning, this tool transforms complex probability calculations into clear, actionable signals—perfect for both data-driven traders seeking statistical edge and investors who value probability-based confirmation!
🟢 Core Architecture
At its heart, this indicator employs an adaptive dual-timeframe Bayesian framework with flexible scanning capabilities. It utilizes a configurable loop start parameter that lets you fine-tune how recent price action influences probability calculations. By combining adaptive scanning with short-term and long-term Bayesian probabilities, the indicator creates a sophisticated yet clear framework for trend identification that dynamically adjusts to market conditions.

🟢 Technical Foundation
The indicator builds on three innovative components:

🟢 Key Features & Signals
The Adaptive Dual Bayesian For Loop transforms complex calculations into clear visual signals:

🟢 Practical Usage Tips
Here's how you can get the most out of the Dual Bayesian For Loop:
1/ Setup:
2/ Signal Interpretation:
🟢 Pro Tips
🟢 Core Architecture
At its heart, this indicator employs an adaptive dual-timeframe Bayesian framework with flexible scanning capabilities. It utilizes a configurable loop start parameter that lets you fine-tune how recent price action influences probability calculations. By combining adaptive scanning with short-term and long-term Bayesian probabilities, the indicator creates a sophisticated yet clear framework for trend identification that dynamically adjusts to market conditions.
🟢 Technical Foundation
The indicator builds on three innovative components:
- Adaptive Loop Scanner: Dynamically evaluates price relationships with adjustable start points for precise control over historical analysis
- Bayesian Probability Engine: Transforms market movements into probability scores through statistical modeling
- Dual Timeframe Integration: Merges immediate market reactions with broader probability trends through custom smoothing
🟢 Key Features & Signals
The Adaptive Dual Bayesian For Loop transforms complex calculations into clear visual signals:
- Binary probability signal displaying definitive trend direction
- Dynamic color-coding system for instant trend recognition
- Strategic L/S markers at key probability reversals
- Customizable bar coloring based on probability trends
- Comprehensive alert system for probability-based shifts
🟢 Practical Usage Tips
Here's how you can get the most out of the Dual Bayesian For Loop:
1/ Setup:
- Add the indicator to your TradingView chart by clicking on the star icon to add it to your favorites ⭐️
- Start with default source for balanced price representation
- Use standard length for probability calculations
- Begin with Loop Start at 1 for complete price analysis
- Start with default Loop Lookback at 70 for reliable sampling size
2/ Signal Interpretation:
- Monitor probability transitions across the 50% threshold (0 line)
- Watch for convergence of short and long-term probabilities
- Use L/S markers for potential trade signals
- Monitor bar colors for additional trend confirmation
- Configure alerts for significant trend crossovers and reversals, ensuring you can act on market movements promptly, even when you’re not actively monitoring the charts
🟢 Pro Tips
- Fine-tune loop parameters for optimal sensitivity:
→ Lower Loop Start (1-5) for more reactive analysis
→ Higher Loop Start (5-10) to filter out noise
- Adjust probability calculation period:
→ Shorter lengths (5-10) for aggressive signals
→ Longer lengths (15-30) for trend confirmation
- Strategy Enhancement:
→ Compare signals across multiple timeframes
→ Combine with volume for trade validation
→ Use with support/resistance levels for entry timing
→ Integrate other technical tools for even more comprehensive analysis
Nota Keluaran
Updated script.Skrip sumber terbuka
Dalam semangat TradingView sebenar, pencipta skrip ini telah menjadikannya sumber terbuka, jadi pedagang boleh menilai dan mengesahkan kefungsiannya. Terima kasih kepada penulis! Walaupuan anda boleh menggunakan secara percuma, ingat bahawa penerbitan semula kod ini tertakluk kepada Peraturan Dalaman.
👉 Access our best trading & investing tools here (3-day FREE trial): whop.com/quantalgo/
Penafian
Maklumat dan penerbitan adalah tidak bertujuan, dan tidak membentuk, nasihat atau cadangan kewangan, pelaburan, dagangan atau jenis lain yang diberikan atau disahkan oleh TradingView. Baca lebih dalam Terma Penggunaan.
Skrip sumber terbuka
Dalam semangat TradingView sebenar, pencipta skrip ini telah menjadikannya sumber terbuka, jadi pedagang boleh menilai dan mengesahkan kefungsiannya. Terima kasih kepada penulis! Walaupuan anda boleh menggunakan secara percuma, ingat bahawa penerbitan semula kod ini tertakluk kepada Peraturan Dalaman.
👉 Access our best trading & investing tools here (3-day FREE trial): whop.com/quantalgo/
Penafian
Maklumat dan penerbitan adalah tidak bertujuan, dan tidak membentuk, nasihat atau cadangan kewangan, pelaburan, dagangan atau jenis lain yang diberikan atau disahkan oleh TradingView. Baca lebih dalam Terma Penggunaan.