PROTECTED SOURCE SCRIPT
NeBlok Support & Resistances
What this indicator does
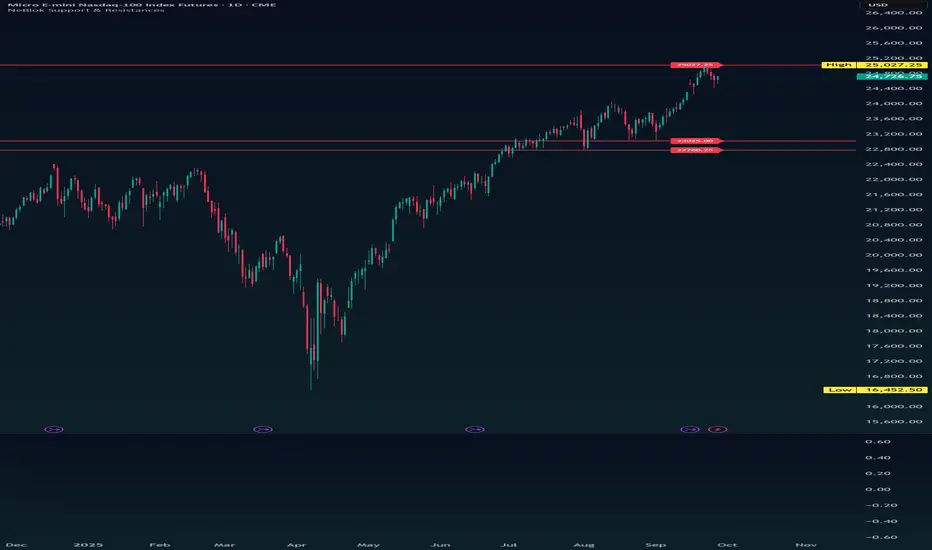
Plots four live horizontal levels based on recent extremes:
30-bar High (30H) and 30-bar Low (30L)
60-bar High (60H) and 60-bar Low (60L)
Lines auto-update every bar as new highs/lows form.
Right-edge price labels show the exact value of each line so you don’t need to read the scale.
You can choose whether the lines extend to the right only (cleanest) or both directions (span the whole chart).
Why 30 & 60 bars?
They’re simple, robust “recent structure” windows:
30 bars ≈ short-term range
60 bars ≈ medium-term range
Using both lets you see near vs. broader context at a glance (e.g., a 30-bar breakout that is still inside the 60-bar range).
Inputs & what they do
Lookback A (bars): default 30. Sets the window for the short-term high/low.
Lookback B (bars): default 60. Sets the window for the medium-term high/low.
Line width: cosmetic thickness of the lines.
Extend direction:
Right → draws rays to the right (minimal clutter, great for current trading).
Both → spans full chart (nice for back-reading context).
Line & label color: single color for lines and label background.
Show right-side labels: toggle labels on/off.
Label bars to the right: how far past the last candle the labels sit.
Label pad (ticks): nudge labels slightly above highs / below lows so text isn’t covered by the line.
How to read & trade the levels
Use them as dynamic support/resistance:
1) Breakout play
Long: Price closes above 30H → momentum breakout.
Optional filter: Only take if price is also above 60H (stronger context).
Risk: Stop just under 30H (or last swing low).
Target: Partial at measured move or next HTF level; trail under 30H.
Short: Price closes below 30L → downside breakout (mirror rules).
2) Range/Mean-reversion
Inside the 60-bar range, treat 30H/30L as inner range edges:
Fade probes into 30H with stops a few ticks beyond; target mid-range or 30L.
If price tags 60H/60L, expect stronger reactions; use tighter stops and smaller size or wait for confirmation (e.g., rejection wick / close back inside).
3) Multi-frame confluence
Keep the 60-bar levels as your context rails; then act when the 30-bar levels align (e.g., 30H breaks while price is already above 60H).
4) Trailing/risk management
For longs, a simple rule: if price re-enters below 30H after a breakout, lighten or exit.
For shorts, mirror with 30L.
Setup & tips
Add to chart → Paste the script into Pine Editor → Save → Add to chart.
Set your lookbacks to match your timeframe and product:
Intraday scalping (1–5m): 30/60 is a good default.
Higher TF (15–60m): consider 50/100 or 100/200.
Clean view: Use Extend: Right and keep labels on; it reduces clutter.
Combine with a trigger: The lines define the area; your trigger can be:
Close beyond a line
Volume expansion
Candle confirmation (e.g., engulfing after a tag)
Your existing EMA/MACD logic
Backtest visually: Switch to Extend: Both to see historical interactions quickly.
Skrip dilindungi
Skrip ini diterbitkan sebagai sumber tertutup. Akan tetapi, anda boleh menggunakannya dengan percuma dan tanpa had – ketahui lebih lanjut di sini.
Penafian
Maklumat dan penerbitan adalah tidak dimaksudkan untuk menjadi, dan tidak membentuk, nasihat untuk kewangan, pelaburan, perdagangan dan jenis-jenis lain atau cadangan yang dibekalkan atau disahkan oleh TradingView. Baca dengan lebih lanjut di Terma Penggunaan.