OPEN-SOURCE SCRIPT
Relative Strength Daily/Weekly
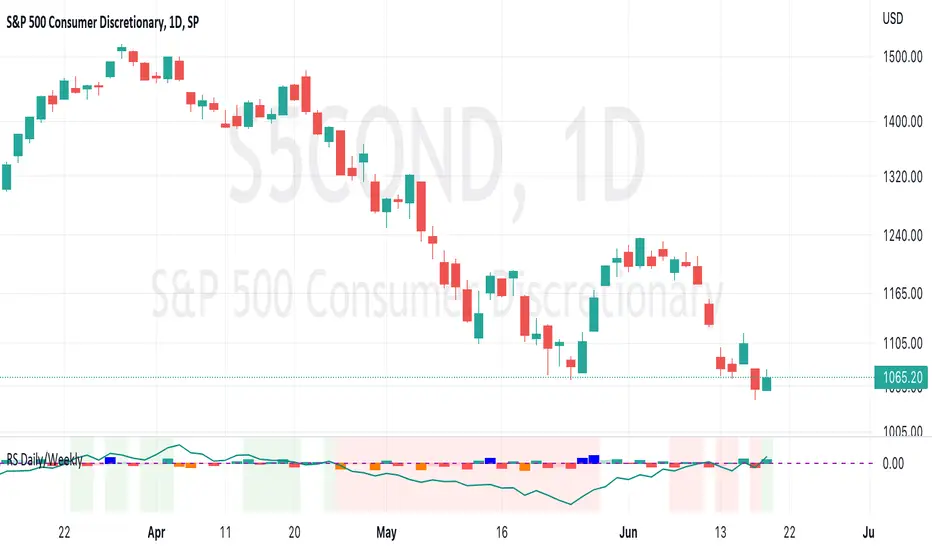
This script measures and plots the movement of the current ticker against a reference ticker. It can be used on any timeframe, however the default values are designed around the Daily timeframe.
The columns show the relative strength or weakness of the current ticker against the reference for the single candle it lies under.
If the current ticker is showing relative strength on any particular day, the column will be either green or blue. The default colour is light green but if the ticker is showing more relative strength than the previous day, the column will be dark green. The column will be blue when the ticker is showing the highest level of relative strength when compared to the previous 21 candles.
If the ticker is showing relative weakness on any particular day, the column will either be red or orange. The default colour is light red but if the ticker is showing more relative weakness than the previous day, the column will be dark red. The column will be orange when the ticker is showing the highest level of relative weakness when compared to the previous 21 candles.
Relative strength is calculated by ((close - previous close)/previous close) - ((reference close - previous reference close)/previous reference close) * 1000
The multiplication by 1000 is simply to help the plot be more useful visually.
The line plots the same calculation but compares the current closes against their respective closes 21 candles earlier.
If the the current ticker is showing relative strength when referenced against the closes 5 bars earlier and when referenced against the closes 21 bars earlier, the background will shade green. If the current ticker shows relative weakness across those same conditions, the background will shade red.
Skrip sumber terbuka
Dalam semangat TradingView sebenar, pencipta skrip ini telah menjadikannya sumber terbuka, jadi pedagang boleh menilai dan mengesahkan kefungsiannya. Terima kasih kepada penulis! Walaupuan anda boleh menggunakan secara percuma, ingat bahawa penerbitan semula kod ini tertakluk kepada Peraturan Dalaman.
Penafian
Maklumat dan penerbitan adalah tidak bertujuan, dan tidak membentuk, nasihat atau cadangan kewangan, pelaburan, dagangan atau jenis lain yang diberikan atau disahkan oleh TradingView. Baca lebih dalam Terma Penggunaan.