OPEN-SOURCE SCRIPT
[blackcat] L1 Bollinger Bands Width Watcher
OVERVIEW
The [blackcat] Bollinger Bands Width Watcher is an advanced tool designed to monitor the width of Bollinger Bands, providing insights into market volatility and potential trend reversals. This indicator calculates both absolute and relative widths of the bands, plotting them on the chart for easy visualization. It also generates buy and sell signals based on crossover events, helping traders make informed decisions 📊✅.
Today, this article introduces the final member of the Bollinger Bands trio—Bollinger Bands Width (BBW). Derived from the renowned Bollinger Bands, this indicator measures price volatility and identifies trading signals. First, let’s delve into what Bollinger Bands are. They consist of three lines associated with the price of a security:
The middle line is typically a 20-day Simple Moving Average (SMA).
The upper and lower bands represent two standard deviations above and below the middle band.
The Bollinger Bands Width measures the distance between these upper and lower bands.
Bollinger Bands Width = (Upper Band - Lower Band) / Middle Band
Calculating BBW involves subtracting the lower band from the upper band and dividing by the middle band to obtain the BBW value. However, interpreting BBW values alone isn't enough to determine if they're narrow or wide. Different instruments or timeframes might define narrowness differently. To gauge the significance of band narrowing accurately, analyzing past BBW fluctuations alongside price movements is essential.
One prominent theory involving Bollinger Bands is the "squeeze." A squeeze setup comprises two phases:
Low volatility, where bands narrow, and prices move sideways.
Increased volatility, where prices breach either the upper or lower band, initiating a new trend.
During a bullish squeeze, BBW diminishes, and breaking above the upper band signals a new uptrend. Conversely, in a bearish squeeze, BBW declines, and falling below the lower band indicates a new downtrend.
While BBW excels at spotting squeezes, traders must exercise caution. Even with a squeeze setup, a robust market trend might not materialize. Validating breakouts necessitates personal judgment and additional confirmation techniques.
Now, let's explore key parameters and settings:
Length: Defines the period for computing the base SMA, defaulting to 20 days.
Source: Specifies the data source per candle, defaulting to the closing price.
Standard Deviation: Sets the number of standard deviations from the SMA for the upper and lower bands, defaulting to 2.
FEATURES
Calculates Bollinger Bands Width using customizable parameters:
Smoothing Length: Number of bars used for calculating the moving average and standard deviation.
Source Price: Defaults to closing prices but can be adjusted.
Standard Deviation Multiplier: Controls the width of the bands.
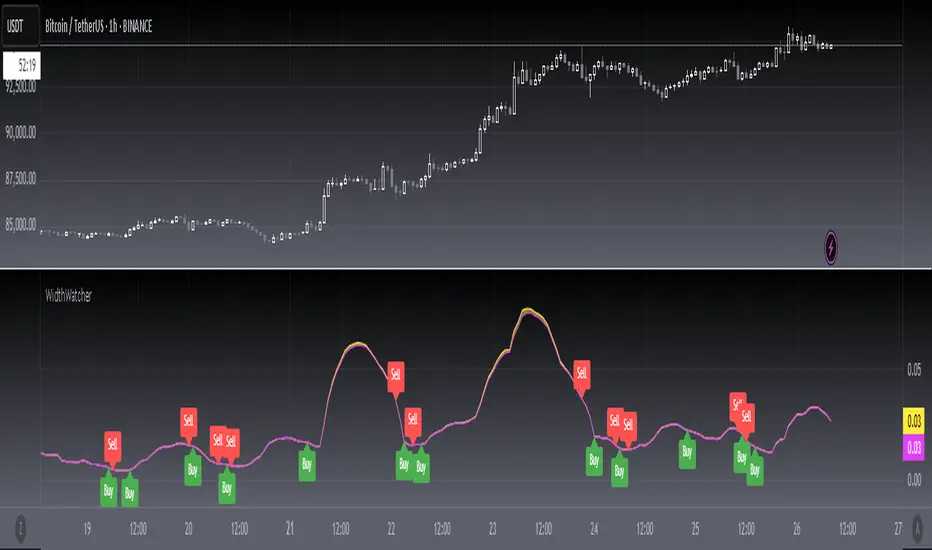
Plots two types of Bollinger Bands Width:
Absolute width relative to the basis (Yellow Line).
Relative width compared to the close price (Fuchsia Line).
Fills the area between the two plotted lines for better visual context 🌈
Generates buy ('Buy') and sell ('Sell') labels based on crossover events 🏷️
Provides alerts for crossover signals to notify users of potential trade opportunities 🔔
HOW TO USE
Add the indicator to your TradingView chart by selecting it from the indicators list.
Adjust the Smoothing Length, Source Price, and Standard Deviation Multiplier as needed ⚙️.
Observe the plotted Bollinger Bands Width lines and filled areas for insights into market volatility.
Monitor the chart for buy and sell labels indicating potential trade opportunities.
Set up alerts based on the generated signals to receive notifications when conditions are met 📲.
LIMITATIONS
The indicator may generate false signals in highly volatile or ranging markets 🌪️.
Users should combine this indicator with other forms of analysis for more reliable trading decisions.
The effectiveness of the indicator may vary depending on the asset and timeframe being analyzed.
NOTES
Ensure that you have sufficient historical data available for accurate calculations.
Test the indicator thoroughly on demo accounts before applying it to live trading 🔍.
Customize the appearance and parameters as needed to fit your trading strategy.
The [blackcat] Bollinger Bands Width Watcher is an advanced tool designed to monitor the width of Bollinger Bands, providing insights into market volatility and potential trend reversals. This indicator calculates both absolute and relative widths of the bands, plotting them on the chart for easy visualization. It also generates buy and sell signals based on crossover events, helping traders make informed decisions 📊✅.
Today, this article introduces the final member of the Bollinger Bands trio—Bollinger Bands Width (BBW). Derived from the renowned Bollinger Bands, this indicator measures price volatility and identifies trading signals. First, let’s delve into what Bollinger Bands are. They consist of three lines associated with the price of a security:
The middle line is typically a 20-day Simple Moving Average (SMA).
The upper and lower bands represent two standard deviations above and below the middle band.
The Bollinger Bands Width measures the distance between these upper and lower bands.
Bollinger Bands Width = (Upper Band - Lower Band) / Middle Band
Calculating BBW involves subtracting the lower band from the upper band and dividing by the middle band to obtain the BBW value. However, interpreting BBW values alone isn't enough to determine if they're narrow or wide. Different instruments or timeframes might define narrowness differently. To gauge the significance of band narrowing accurately, analyzing past BBW fluctuations alongside price movements is essential.
One prominent theory involving Bollinger Bands is the "squeeze." A squeeze setup comprises two phases:
Low volatility, where bands narrow, and prices move sideways.
Increased volatility, where prices breach either the upper or lower band, initiating a new trend.
During a bullish squeeze, BBW diminishes, and breaking above the upper band signals a new uptrend. Conversely, in a bearish squeeze, BBW declines, and falling below the lower band indicates a new downtrend.
While BBW excels at spotting squeezes, traders must exercise caution. Even with a squeeze setup, a robust market trend might not materialize. Validating breakouts necessitates personal judgment and additional confirmation techniques.
Now, let's explore key parameters and settings:
Length: Defines the period for computing the base SMA, defaulting to 20 days.
Source: Specifies the data source per candle, defaulting to the closing price.
Standard Deviation: Sets the number of standard deviations from the SMA for the upper and lower bands, defaulting to 2.
FEATURES
Calculates Bollinger Bands Width using customizable parameters:
Smoothing Length: Number of bars used for calculating the moving average and standard deviation.
Source Price: Defaults to closing prices but can be adjusted.
Standard Deviation Multiplier: Controls the width of the bands.
Plots two types of Bollinger Bands Width:
Absolute width relative to the basis (Yellow Line).
Relative width compared to the close price (Fuchsia Line).
Fills the area between the two plotted lines for better visual context 🌈
Generates buy ('Buy') and sell ('Sell') labels based on crossover events 🏷️
Provides alerts for crossover signals to notify users of potential trade opportunities 🔔
HOW TO USE
Add the indicator to your TradingView chart by selecting it from the indicators list.
Adjust the Smoothing Length, Source Price, and Standard Deviation Multiplier as needed ⚙️.
Observe the plotted Bollinger Bands Width lines and filled areas for insights into market volatility.
Monitor the chart for buy and sell labels indicating potential trade opportunities.
Set up alerts based on the generated signals to receive notifications when conditions are met 📲.
LIMITATIONS
The indicator may generate false signals in highly volatile or ranging markets 🌪️.
Users should combine this indicator with other forms of analysis for more reliable trading decisions.
The effectiveness of the indicator may vary depending on the asset and timeframe being analyzed.
NOTES
Ensure that you have sufficient historical data available for accurate calculations.
Test the indicator thoroughly on demo accounts before applying it to live trading 🔍.
Customize the appearance and parameters as needed to fit your trading strategy.
Skrip sumber terbuka
Dalam semangat TradingView sebenar, pencipta skrip ini telah menjadikannya sumber terbuka, jadi pedagang boleh menilai dan mengesahkan kefungsiannya. Terima kasih kepada penulis! Walaupuan anda boleh menggunakan secara percuma, ingat bahawa penerbitan semula kod ini tertakluk kepada Peraturan Dalaman.
Avoid losing contact!Don't miss out! The first and most important thing to do is to join my Discord chat now! Click here to start your adventure: discord.com/invite/ZTGpQJq 防止失联,请立即行动,加入本猫聊天群: discord.com/invite/ZTGpQJq
Penafian
Maklumat dan penerbitan adalah tidak bertujuan, dan tidak membentuk, nasihat atau cadangan kewangan, pelaburan, dagangan atau jenis lain yang diberikan atau disahkan oleh TradingView. Baca lebih dalam Terma Penggunaan.