OPEN-SOURCE SCRIPT
Telah dikemas kini Line break
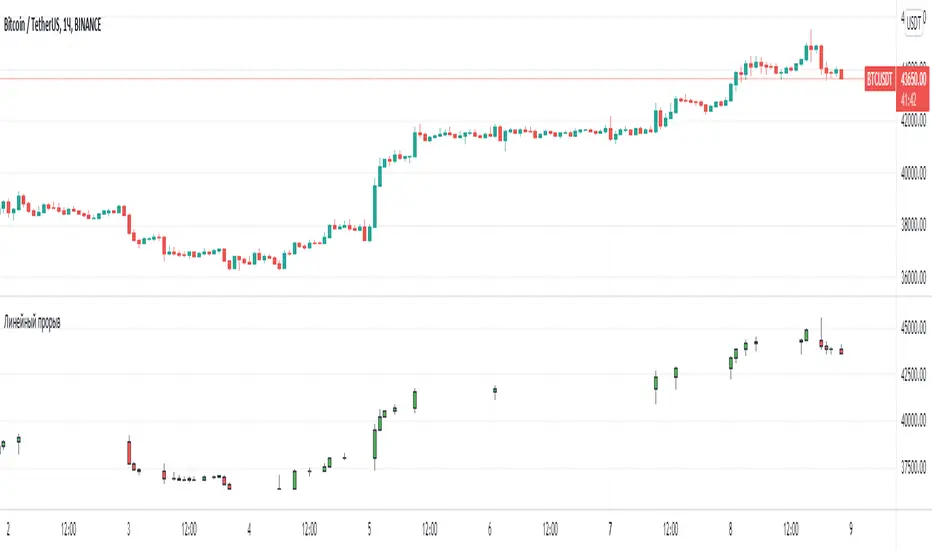
I decided to help TradingView programmers and wrote code that converts a standard candles / bars to a line break chart. The built-in linebreak() and security() functions for constructing a Linear Break chart are bad, the chart is not built correctly, and does not correspond to the Line Breakout chart built into TradingView. I’m talking about simulating the Linear Break lines using the plotcandle() annotation, because these are the same candles without shadows. When you try to use the market simulator, when the gaps are turned on in the security() function, nothing is added to the chart, and when turned off, a completely different line break chart is drawn. Do not try to write strategies based on the built-in linebreak() function! The developers write in the manual: "Please note that you cannot plot Line Break boxes from Pine script exactly as they look. You can only get a series of numbers similar to OHLC values for Line Break charts and use them in your algorithms." However, it is possible to build a “Linear Breakthrough” chart exactly like the “Linear Breakthrough" chart built into TradingView. Personally, I had enough Pine Script functionality.
For a complete understanding of how such a graph is built, you can refer to Steve Nison's book “BEYOND JAPANESE CANDLES” and see the instructions for creating a “Three-Line Breakthrough” chart (the number of lines for a breakthrough is three):
Rule 1: if today's price is above the base price (closing the first candle), draw a white line from the base price to the new maximum price (before closing).
or Rule 2: if today's price is below the base price, draw a black line from the base price to the new low of prices (before closing).
Rule 3: if today's price is no different from the base, do not draw any line.
Rule 4: if today's price rises above the maximum of the first line, shift to the column to the right and draw a new white line from the previous maximum to the new maximum of prices.
Rule 5: if the price is below the low of the first line, move one column to the right and draw a new black line down from the previous low to the new low of prices.
Rule 6: if the price is kept in the range of the first line, nothing is applied to the chart.
Rule 7: if the market reaches a new maximum, surpassing the maximum of previous lines, move to the column to the right and draw a new white line up to a new maximum.
Rule 8: if today's price is below the low of previous lines (i.e. there is a new low), move to the right column and draw a new black line down to a new low.
Rule 9: if the price is in the range of the first two lines, nothing is applied to the chart.
Rule 10: if there is a series of three white lines, a new white line is drawn when a new maximum is reached (even if it is only one tick higher than the old one). Under the same conditions, for drawing a black reversal line, the price should fall below the minimum of the series of the last three white lines. Such a black line is called a black reversal line. It runs from the base of the highest white line to a new low of price.
Rule 11: if there is a series of three black lines, a new black line is drawn when a new minimum is reached. Under the same conditions, for drawing a white line, called a white reversal line, the price must exceed the maximum of the previous three black lines. This line is drawn from the top of the lowest black line to a new high of the price.
So, the script was not small, but the idea is extremely simple: if you need to break n lines to build a line, then among these n lines (or less, if this is the beginning of the chart), the maximum or minimum of closures and openings will be searched. If the current candles closed above or below these highs or lows, then a new line is added to the chart on the current candles (trend or breakout). According to my observations, this script draws a chart that is completely identical to the Line Breakout chart built into TradingView, but of course with gaps, as there is time in the candles / bar chart. I stuffed all the logic into a wrapper in the form of the get_linebreak() function, which returns a tuple of OHLC values. And these series with the help of the plotcandle() annotation can be converted to the "Linear Breakthrough" chart. I also want to note that with a large number of candles on the chart, outrages about the buffer size uncertainty are heard from the TradingView black box. Because of this, in the annotation study() set the value to the max_bars_back parameter.
In general, use it (for example, to write strategies)!
Nota Keluaran
Fixed a big bug related to adding lines when gaps.There is "LBS" indicator on the chart. This is built-in linebreak() function. Below you can see the work of the previous version with a bug. The problem with the built-in linebreak() function is that it does not draw lines in real time, that is, the indicator repaints. But my algorithm works nice.
By the way, the script has become much shorter thanks to the arrays.
Nota Keluaran
Small fixes to make the post look nice.Nota Keluaran
Added the ability to turn on the wickes for lines.Nota Keluaran
Just the jump of the algorithm to 5 Pine Script version.Skrip sumber terbuka
Dalam semangat sebenar TradingView, pencipta skrip ini telah menjadikannya sumber terbuka supaya pedagang dapat menilai dan mengesahkan kefungsiannya. Terima kasih kepada penulis! Walaupun anda boleh menggunakannya secara percuma, ingat bahawa menerbitkan semula kod ini adalah tertakluk kepada Peraturan Dalaman kami.
Penafian
Maklumat dan penerbitan adalah tidak dimaksudkan untuk menjadi, dan tidak membentuk, nasihat untuk kewangan, pelaburan, perdagangan dan jenis-jenis lain atau cadangan yang dibekalkan atau disahkan oleh TradingView. Baca dengan lebih lanjut di Terma Penggunaan.
Skrip sumber terbuka
Dalam semangat sebenar TradingView, pencipta skrip ini telah menjadikannya sumber terbuka supaya pedagang dapat menilai dan mengesahkan kefungsiannya. Terima kasih kepada penulis! Walaupun anda boleh menggunakannya secara percuma, ingat bahawa menerbitkan semula kod ini adalah tertakluk kepada Peraturan Dalaman kami.
Penafian
Maklumat dan penerbitan adalah tidak dimaksudkan untuk menjadi, dan tidak membentuk, nasihat untuk kewangan, pelaburan, perdagangan dan jenis-jenis lain atau cadangan yang dibekalkan atau disahkan oleh TradingView. Baca dengan lebih lanjut di Terma Penggunaan.