OPEN-SOURCE SCRIPT
Orthogonal Projections to Latent Structures (O-PLS)
Version 0.1
Orthogonal Projections to Latent Structures (O-PLS) Indicator for TradingView
This indicator, named "Orthogonal Projections to Latent Structures (O-PLS)", is designed to help traders understand the relevance or predictive power of various market variables on the future close price of the asset it's applied to. Unlike standard correlation coefficients that show a simple linear relationship, O-PLS aims to separate variables into "predictive" (relevant to Y) and "orthogonal" (irrelevant noise) components. This Pine Script indicator provides a simplified proxy of the relevance score derived from O-PLS principles.
Purpose of the Indicator
The primary purpose of this indicator is to identify which technical factors (such as price, volume, and other indicators) have the strongest relationship with the future price movement of the current trading instrument. By providing a "relevance score" for each input variable, it helps traders focus on the most influential data points, potentially leading to more informed trading decisions.
Inputs
The indicator offers the following user-definable inputs:
* **Lookback Period:** This integer input (default: 100, min: 10, max: 500) determines the number of past bars used to calculate the relevance scores for each variable. A longer lookback period considers more historical data, which can lead to smoother, less reactive scores but might miss recent shifts in variable importance.
* **External Asset Symbol:** This symbol input (default: `BINANCE:BTCUSDT`) allows you to specify an external asset (e.g., `BINANCE:ETHUSDT`, `NASDAQ:TSLA`) whose close price will be included in the analysis as an additional variable. This is useful for cross-market analysis to see how other assets influence the current chart.
* **Plot Visibility Checkboxes (e.g., "Plot: Open Price Relevance", "Plot: Volume Relevance", etc.):** These boolean checkboxes allow you to toggle the visibility of individual relevance score plots on the chart, helping to declutter the display and focus on specific variables.
Outputs
The indicator provides two main types of output:
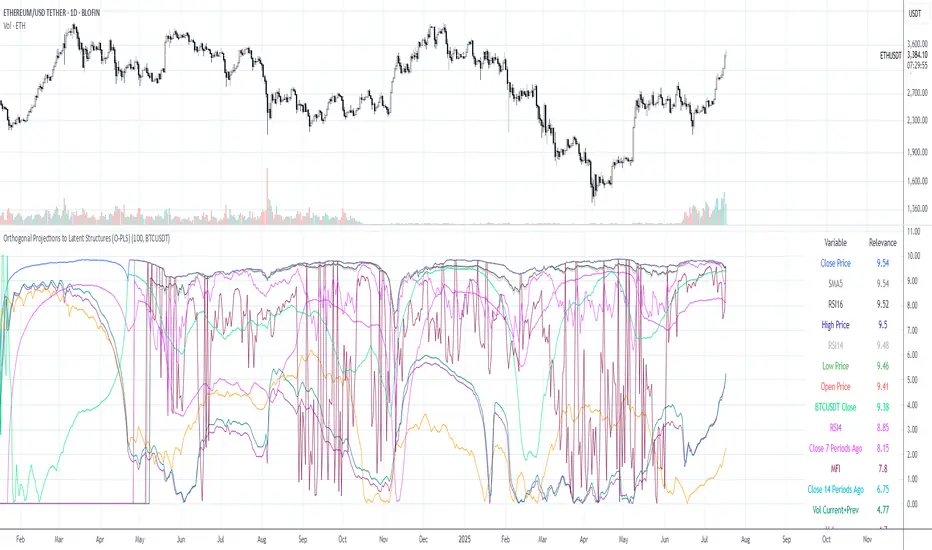
Relevance Score Plots: These are lines plotted in a separate pane below the main price chart. Each line corresponds to a specific market variable (Open Price, Close Price, High Price, Low Price, Volume, various RSIs, SMAs, MFI, and the External Asset Close). The value of each line represents the calculated "relevance score" for that variable, typically scaled between 0 and 10. A higher score indicates a stronger predictive relationship with the future close price.
Sorted Relevance Table: A table displayed in the top-right corner of the chart provides a clear, sorted list of all analyzed variables and their corresponding relevance scores. The table is sorted in descending order of relevance, making it easy to identify the most influential factors at a glance. Each variable name in the table is colored according to its plot color, and the external asset's name is dynamically displayed without the "BINANCE:" prefix.
How to Use the Indicator
1. **Add to Chart:** Apply the "Orthogonal Projections to Latent Structures (O-PLS)" indicator to your desired trading chart (e.g., ETH/USDT).
2. **Adjust Inputs:**
* **Lookback Period:** Experiment with different lookback periods to see how the relevance scores change. A shorter period might highlight recent correlations, while a longer one might show more fundamental relationships.
* **External Asset Symbol:** If you trade BTC/USDT, you might add ETH/USDT or SPX as an external asset to see its influence.
3. **Analyze Relevance Scores:**
* **Plots:** Observe the individual relevance score plots over time. Are certain variables consistently high? Do scores change before significant price moves?
* **Table:** Refer to the sorted table on the latest confirmed bar to quickly identify the top-ranked variables.
4. **Incorporate into Strategy:** Use the insights from the relevance scores to:
* Prioritize certain indicators or price actions in your trading strategy. For example, if "Volume" has a high relevance score, it suggests volume confirmation is critical for future price moves.
* Understand the influence of inter-market relationships (via the External Asset Close).
How the Indicator Works
The indicator works by performing the following steps on each bar:
1. **Data Fetching:** It gathers historical data for various price components (open, high, low, close), volume, and calculated technical indicators (SMA, RSI, MFI) for the specified `lookback` period. [cite_start]It also fetches the close price of an `External Asset Symbol`[cite: 1, 2].
2. **Standardization (Z-scoring):** All collected raw data series are standardized by converting them into Z-scores. [cite_start]This involves subtracting the mean of each series and dividing by its standard deviation[cite: 7, 8]. Standardization is crucial because it brings all variables to a common scale, preventing variables with larger absolute values from disproportionately influencing the correlation calculations.
3. [cite_start]**Correlation Calculation (Proxy for O-PLS Relevance):** The indicator then calculates a simplified form of correlation between each standardized input variable and the standardized future close price (Y variable)[cite: 8, 9, 10]. This correlation is a proxy for the relevance that O-PLS would identify. A high absolute correlation indicates a strong linear relationship.
4. [cite_start]**Relevance Scaling:** The calculated correlation values are then scaled to a range of 0 to 10 to provide an easily interpretable "relevance score"[cite: 10].
5. [cite_start]**Output Display:** The relevance scores are presented both as time-series plots (allowing observation of changes over time) and in a real-time sorted table (for quick identification of top factors on the current bar)[cite: 10, 15].
How it Differs from Full O-PLS
This indicator provides a *simplified proxy* of O-PLS principles rather than a full, mathematically rigorous O-PLS model. Here's why and how it differs:
* **Dimensionality Reduction:** A full O-PLS model would involve complex matrix factorization techniques to decompose the independent variables (X) into components that are predictive of Y and components that are orthogonal (unrelated) to Y but still describe X's variance. Pine Script's array capabilities and computational limits make direct implementation of these matrix operations challenging.
* **Orthogonal Components:** A true O-PLS model explicitly identifies and removes orthogonal components (noise) from the X data that are unrelated to Y. This indicator, in its simplified form, primarily focuses on the direct correlation (relevance) between each X variable and Y after standardization, without explicitly modeling and separating these orthogonal variations.
* **Predictive Model:** A full O-PLS model is ultimately a predictive model that can be used for regression (predicting Y). This indicator, however, focuses solely on **identifying the relevance/correlation of inputs to Y**, rather than building a predictive model for Y itself. It's more of an analytical tool for feature importance than a direct prediction engine.
* **Computational Intensity:** Full O-PLS involves Singular Value Decomposition (SVD) or Partial Least Squares (PLS) algorithms, which are computationally intensive. The indicator uses simpler statistical measures (mean, standard deviation, and direct correlation calculation over a lookback window) that are feasible within Pine Script's execution limits.
In essence, this Pine Script indicator serves as a practical tool for gaining insights into variable relevance, inspired by the spirit of O-PLS, but adapted for the constraints and common use cases of a TradingView environment.
Orthogonal Projections to Latent Structures (O-PLS) Indicator for TradingView
This indicator, named "Orthogonal Projections to Latent Structures (O-PLS)", is designed to help traders understand the relevance or predictive power of various market variables on the future close price of the asset it's applied to. Unlike standard correlation coefficients that show a simple linear relationship, O-PLS aims to separate variables into "predictive" (relevant to Y) and "orthogonal" (irrelevant noise) components. This Pine Script indicator provides a simplified proxy of the relevance score derived from O-PLS principles.
Purpose of the Indicator
The primary purpose of this indicator is to identify which technical factors (such as price, volume, and other indicators) have the strongest relationship with the future price movement of the current trading instrument. By providing a "relevance score" for each input variable, it helps traders focus on the most influential data points, potentially leading to more informed trading decisions.
Inputs
The indicator offers the following user-definable inputs:
* **Lookback Period:** This integer input (default: 100, min: 10, max: 500) determines the number of past bars used to calculate the relevance scores for each variable. A longer lookback period considers more historical data, which can lead to smoother, less reactive scores but might miss recent shifts in variable importance.
* **External Asset Symbol:** This symbol input (default: `BINANCE:BTCUSDT`) allows you to specify an external asset (e.g., `BINANCE:ETHUSDT`, `NASDAQ:TSLA`) whose close price will be included in the analysis as an additional variable. This is useful for cross-market analysis to see how other assets influence the current chart.
* **Plot Visibility Checkboxes (e.g., "Plot: Open Price Relevance", "Plot: Volume Relevance", etc.):** These boolean checkboxes allow you to toggle the visibility of individual relevance score plots on the chart, helping to declutter the display and focus on specific variables.
Outputs
The indicator provides two main types of output:
Relevance Score Plots: These are lines plotted in a separate pane below the main price chart. Each line corresponds to a specific market variable (Open Price, Close Price, High Price, Low Price, Volume, various RSIs, SMAs, MFI, and the External Asset Close). The value of each line represents the calculated "relevance score" for that variable, typically scaled between 0 and 10. A higher score indicates a stronger predictive relationship with the future close price.
Sorted Relevance Table: A table displayed in the top-right corner of the chart provides a clear, sorted list of all analyzed variables and their corresponding relevance scores. The table is sorted in descending order of relevance, making it easy to identify the most influential factors at a glance. Each variable name in the table is colored according to its plot color, and the external asset's name is dynamically displayed without the "BINANCE:" prefix.
How to Use the Indicator
1. **Add to Chart:** Apply the "Orthogonal Projections to Latent Structures (O-PLS)" indicator to your desired trading chart (e.g., ETH/USDT).
2. **Adjust Inputs:**
* **Lookback Period:** Experiment with different lookback periods to see how the relevance scores change. A shorter period might highlight recent correlations, while a longer one might show more fundamental relationships.
* **External Asset Symbol:** If you trade BTC/USDT, you might add ETH/USDT or SPX as an external asset to see its influence.
3. **Analyze Relevance Scores:**
* **Plots:** Observe the individual relevance score plots over time. Are certain variables consistently high? Do scores change before significant price moves?
* **Table:** Refer to the sorted table on the latest confirmed bar to quickly identify the top-ranked variables.
4. **Incorporate into Strategy:** Use the insights from the relevance scores to:
* Prioritize certain indicators or price actions in your trading strategy. For example, if "Volume" has a high relevance score, it suggests volume confirmation is critical for future price moves.
* Understand the influence of inter-market relationships (via the External Asset Close).
How the Indicator Works
The indicator works by performing the following steps on each bar:
1. **Data Fetching:** It gathers historical data for various price components (open, high, low, close), volume, and calculated technical indicators (SMA, RSI, MFI) for the specified `lookback` period. [cite_start]It also fetches the close price of an `External Asset Symbol`[cite: 1, 2].
2. **Standardization (Z-scoring):** All collected raw data series are standardized by converting them into Z-scores. [cite_start]This involves subtracting the mean of each series and dividing by its standard deviation[cite: 7, 8]. Standardization is crucial because it brings all variables to a common scale, preventing variables with larger absolute values from disproportionately influencing the correlation calculations.
3. [cite_start]**Correlation Calculation (Proxy for O-PLS Relevance):** The indicator then calculates a simplified form of correlation between each standardized input variable and the standardized future close price (Y variable)[cite: 8, 9, 10]. This correlation is a proxy for the relevance that O-PLS would identify. A high absolute correlation indicates a strong linear relationship.
4. [cite_start]**Relevance Scaling:** The calculated correlation values are then scaled to a range of 0 to 10 to provide an easily interpretable "relevance score"[cite: 10].
5. [cite_start]**Output Display:** The relevance scores are presented both as time-series plots (allowing observation of changes over time) and in a real-time sorted table (for quick identification of top factors on the current bar)[cite: 10, 15].
How it Differs from Full O-PLS
This indicator provides a *simplified proxy* of O-PLS principles rather than a full, mathematically rigorous O-PLS model. Here's why and how it differs:
* **Dimensionality Reduction:** A full O-PLS model would involve complex matrix factorization techniques to decompose the independent variables (X) into components that are predictive of Y and components that are orthogonal (unrelated) to Y but still describe X's variance. Pine Script's array capabilities and computational limits make direct implementation of these matrix operations challenging.
* **Orthogonal Components:** A true O-PLS model explicitly identifies and removes orthogonal components (noise) from the X data that are unrelated to Y. This indicator, in its simplified form, primarily focuses on the direct correlation (relevance) between each X variable and Y after standardization, without explicitly modeling and separating these orthogonal variations.
* **Predictive Model:** A full O-PLS model is ultimately a predictive model that can be used for regression (predicting Y). This indicator, however, focuses solely on **identifying the relevance/correlation of inputs to Y**, rather than building a predictive model for Y itself. It's more of an analytical tool for feature importance than a direct prediction engine.
* **Computational Intensity:** Full O-PLS involves Singular Value Decomposition (SVD) or Partial Least Squares (PLS) algorithms, which are computationally intensive. The indicator uses simpler statistical measures (mean, standard deviation, and direct correlation calculation over a lookback window) that are feasible within Pine Script's execution limits.
In essence, this Pine Script indicator serves as a practical tool for gaining insights into variable relevance, inspired by the spirit of O-PLS, but adapted for the constraints and common use cases of a TradingView environment.
Skrip sumber terbuka
Dalam semangat TradingView sebenar, pencipta skrip ini telah menjadikannya sumber terbuka, jadi pedagang boleh menilai dan mengesahkan kefungsiannya. Terima kasih kepada penulis! Walaupuan anda boleh menggunakan secara percuma, ingat bahawa penerbitan semula kod ini tertakluk kepada Peraturan Dalaman.
Penafian
Maklumat dan penerbitan adalah tidak bertujuan, dan tidak membentuk, nasihat atau cadangan kewangan, pelaburan, dagangan atau jenis lain yang diberikan atau disahkan oleh TradingView. Baca lebih dalam Terma Penggunaan.