OPEN-SOURCE SCRIPT
Telah dikemas kini VFI - Volume Flow Indicator [UTS]
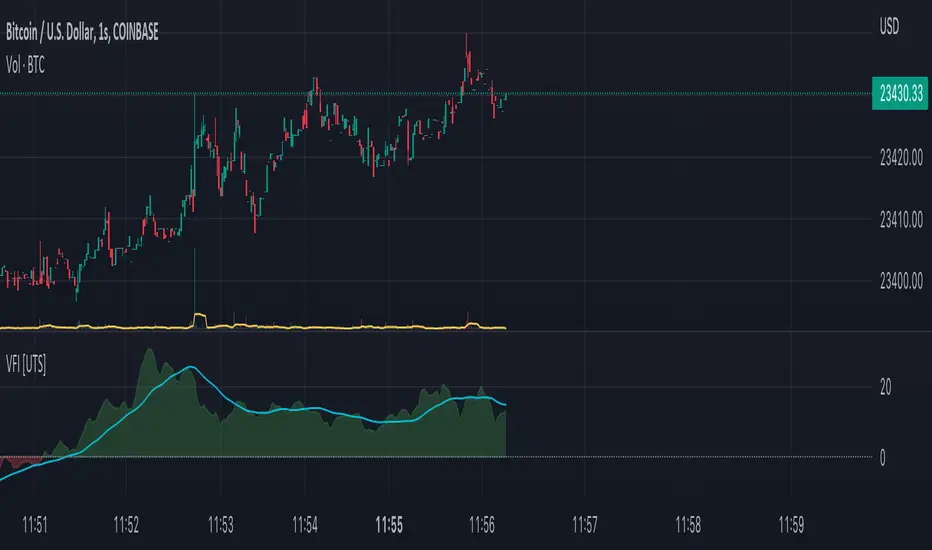
The Volume Flow Indicator (VFI) indicator was first introduced in my June 2004 and is is based on the popular On Balance Volume (OBV) but with three very important modifications:
* Unlike the OBV, indicator values are no longer meaningless. Positive readings are bullish and negative bearish.
* The calculation is based on the day's median instead of the closing price.
* A volatility threshold takes into account minimal price changes and another threshold eliminates excessive volume.
* The indicator takes into account only the latest 6 month volume action and not the entire data loaded in the chart.
General Usage
A simplified interpretation of the VFI is that values above zero indicate a bullish state and the crossing of the zero line is the trigger or buy signal.
The strongest signal with all money flow indicators is of course divergence.
The classic form of divergence is when the indicator refuses to follow the price action and makes lower highs while price makes higher highs (negative divergence). If price reaches a new low but the indicator fails to do so, then price probably traveled lower than it should have. In this instance, you have positive divergence.
Default settings
* 130 VFI Length
* 0.2 Coef
* 2.5 Volume cutoff
* 3 Smoothing Period
Further setting examples can be found on http://www.precisiontradingsystems.com/VOLUME_FLOW.htm
- Trend Visualisation
Optional Setting:
If the trend direction is DOWN the moving average is painted red. If the trend direction is UP the moving average is painted in green.
If the movement is FLAT then the color is grey.
Moving Averages
4 different types of Moving Averages are available for both FVI and the optional Moving Average of the FVI.- ALMA (Arnaud Legoux Moving Average)
- EMA (Exponential Moving Average)
- SMA (Simple Moving Average)
- WMA (Weighted Moving Average)
Notes
This indicator is using the exact formula from http://mkatsanos.com/VFI.html where EMA has been taken as default value for FVI smoothing calculation.
- ALMA (Arnaud Legoux Moving Average)
Nota Keluaran
Corrected wrong study shortname.Nota Keluaran
- Minor improvements to drawings and colors
The Volume Flow Indicator (VFI) indicator was first introduced in my June 2004 and is is based on the popular On Balance Volume (OBV) but with three very important modifications:
- Unlike the OBV, indicator values are no longer meaningless. Positive readings are bullish and negative bearish.
- The calculation is based on the day's median instead of the closing price.
- A volatility threshold takes into account minimal price changes and another threshold eliminates excessive volume.
- The indicator takes into account only the latest 6 month volume action and not the entire data loaded in the chart.
General Usage
A simplified interpretation of the VFI is that values above zero indicate a bullish state and the crossing of the zero line is the trigger or buy signal.
The strongest signal with all money flow indicators is of course divergence.
The classic form of divergence is when the indicator refuses to follow the price action and makes lower highs while price makes higher highs (negative divergence). If price reaches a new low but the indicator fails to do so, then price probably traveled lower than it should have. In this instance, you have positive divergence.
Default settings
- 130 VFI Length
- 0.2 Coef
- 2.5 Volume cutoff
- 3 Smoothing Period
Further setting examples can be found on http:https://www.precisiontradingsystems.com/VOLUME_FLOW.htm
E.g. 40 or 18 Length to achieve different results like in the examples.
Trend Visualisation
Optional: If the trend direction is DOWN the moving average is painted red. If the trend direction is UP the moving average is painted in green.
If the movement is FLAT then the color is grey.
Moving Averages
4 different types of Moving Averages are available for both FVI and the optional Moving Average of the FVI.
- ALMA (Arnaud Legoux Moving Average)
- EMA (Exponential Moving Average)
- SMA (Simple Moving Average)
- WMA (Weighted Moving Average)
Notes
This indicator is using the exact formula from http:mkatsanos.com/VFI.html where EMA has been taken as default value for FVI smoothing calculation.
Nota Keluaran
- Cleaned script
The Volume Flow Indicator (VFI) indicator was first introduced in my June 2004 and is is based on the popular On Balance Volume (OBV) but with three very important modifications:
- Unlike the OBV, indicator values are no longer meaningless. Positive readings are bullish and negative bearish.
- The calculation is based on the day's median instead of the closing price.
- A volatility threshold takes into account minimal price changes and another threshold eliminates excessive volume.
- The indicator takes into account only the latest 6 month volume action and not the entire data loaded in the chart.
General Usage
A simplified interpretation of the VFI is that values above zero indicate a bullish state and the crossing of the zero line is the trigger or buy signal.
The strongest signal with all money flow indicators is of course divergence.
The classic form of divergence is when the indicator refuses to follow the price action and makes lower highs while price makes higher highs (negative divergence). If price reaches a new low but the indicator fails to do so, then price probably traveled lower than it should have. In this instance, you have positive divergence.
Default settings
- 130 VFI Length
- 0.2 Coef
- 2.5 Volume cutoff
- 3 Smoothing Period
Further setting examples can be found on http:https://www.precisiontradingsystems.com/VOLUME_FLOW.htm
E.g. 40 or 18 Length to achieve different results like in the examples.
Trend Visualisation
Optional: If the trend direction is DOWN the moving average is painted red. If the trend direction is UP the moving average is painted in green.
If the movement is FLAT then the color is grey.
Moving Averages
4 different types of Moving Averages are available for both FVI and the optional Moving Average of the FVI.
- ALMA (Arnaud Legoux Moving Average)
- EMA (Exponential Moving Average)
- SMA (Simple Moving Average)
- WMA (Weighted Moving Average)
Notes
This indicator is using the exact formula from http:mkatsanos.com/VFI.html where EMA has been taken as default value for FVI smoothing calculation.
Nota Keluaran
Changelog:* removed compile error failing on ternary operator with anonymous functions
Nota Keluaran
Changelog:- Updated script to Pinescript v5
- Updated Settings UI Panel
Skrip sumber terbuka
Dalam semangat TradingView sebenar, pencipta skrip ini telah menjadikannya sumber terbuka, jadi pedagang boleh menilai dan mengesahkan kefungsiannya. Terima kasih kepada penulis! Walaupuan anda boleh menggunakan secara percuma, ingat bahawa penerbitan semula kod ini tertakluk kepada Peraturan Dalaman.
Visit ubertradingsystems.com or send a direct message for information about indicator access.
Penafian
Maklumat dan penerbitan adalah tidak bertujuan, dan tidak membentuk, nasihat atau cadangan kewangan, pelaburan, dagangan atau jenis lain yang diberikan atau disahkan oleh TradingView. Baca lebih dalam Terma Penggunaan.