OPEN-SOURCE SCRIPT
Indicator: MFI or RSI enclosed by Bollinger Bands
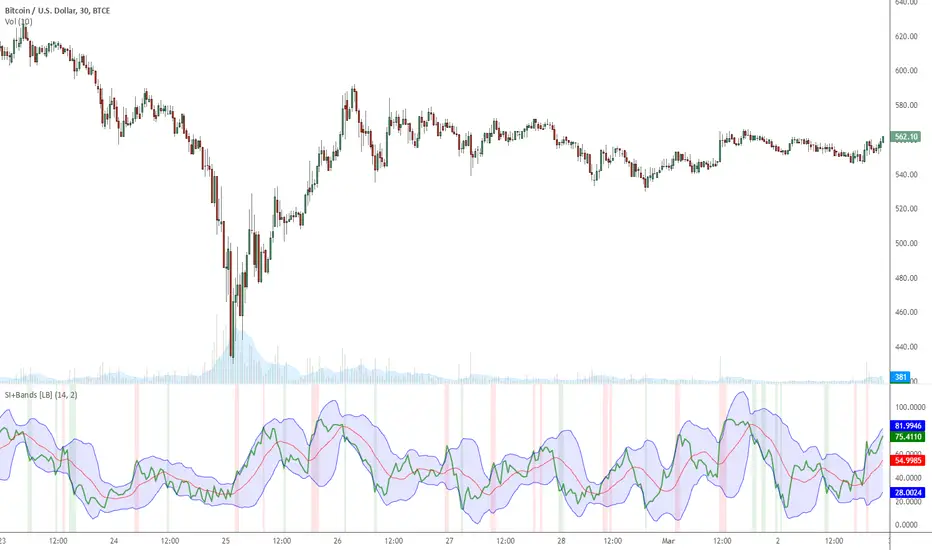
Indicator allows choosing either MFI or RSI and draws a BB over it to identify oversold / overbought conditions.
Oversold/Overbought breaches are highlighted using different colors for easy identification. Has helped me a lot during sudden pumps to identify the tops, hope you find a use for this.
Oversold/Overbought breaches are highlighted using different colors for easy identification. Has helped me a lot during sudden pumps to identify the tops, hope you find a use for this.
Skrip sumber terbuka
Dalam semangat sebenar TradingView, pencipta skrip ini telah menjadikannya sumber terbuka supaya pedagang dapat menilai dan mengesahkan kefungsiannya. Terima kasih kepada penulis! Walaupun anda boleh menggunakannya secara percuma, ingat bahawa menerbitkan semula kod ini adalah tertakluk kepada Peraturan Dalaman kami.
List of my free indicators: bit.ly/1LQaPK8
List of my indicators at Appstore: blog.tradingview.com/?p=970
List of my indicators at Appstore: blog.tradingview.com/?p=970
Penafian
Maklumat dan penerbitan adalah tidak dimaksudkan untuk menjadi, dan tidak membentuk, nasihat untuk kewangan, pelaburan, perdagangan dan jenis-jenis lain atau cadangan yang dibekalkan atau disahkan oleh TradingView. Baca dengan lebih lanjut di Terma Penggunaan.