OPEN-SOURCE SCRIPT
Price Oscillator TR
### Summary: How to Use the Price Oscillator with EMA Indicator
The **Price Oscillator with EMA** is a custom technical analysis tool designed to help traders identify potential buying and selling opportunities based on price momentum. Here's how to use it:
1. **Understanding the Oscillator**:
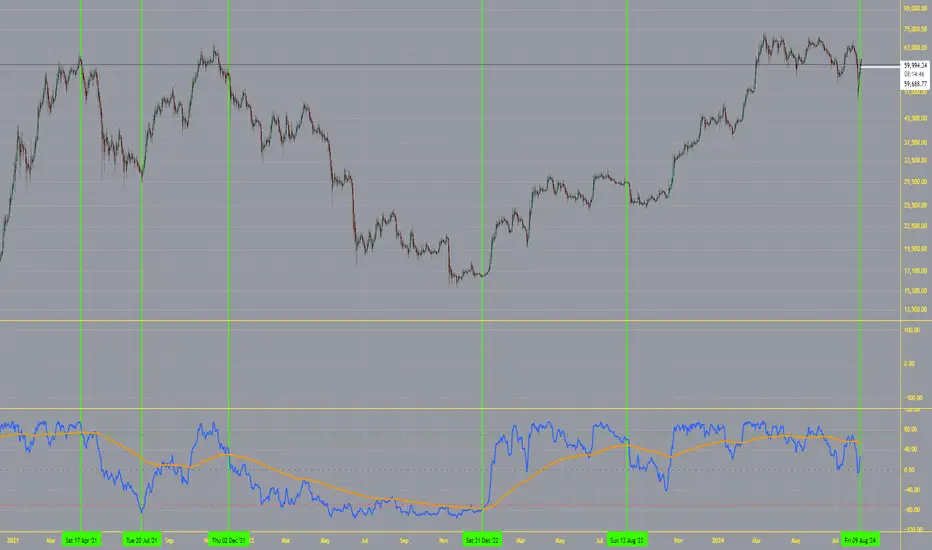
- The oscillator is calculated by normalizing the current price relative to the highest high and lowest low over a specified lookback period. It fluctuates between -70 and +70.
- When the oscillator is near +70, the price is close to the recent highs, indicating potential overbought conditions. Conversely, when it’s near -100, the price is close to recent lows, indicating potential oversold conditions.
2. **Exponential Moving Average (EMA)**:
- The indicator includes an EMA of the oscillator to smooth out price fluctuations and provide a clearer signal.
- The EMA helps to filter out noise and confirm trends.
3. **Trading Signals**:
- **Bullish Signal**: A potential buying opportunity is signaled when the oscillator crosses above its EMA. This suggests increasing upward momentum.
- **Bearish Signal**: A potential selling opportunity is signaled when the oscillator crosses below its EMA. This indicates increasing downward momentum.
4. **Visual Aids**:
- The indicator includes horizontal lines at +70, 0, and -70 to help you quickly assess overbought, neutral, and oversold conditions.
- The blue line represents the oscillator, while the orange line represents the EMA of the oscillator.
### How to Use:
- **Set your parameters**: Adjust the lookback period and EMA length to fit your trading strategy and time frame.
- **Watch for Crossovers**: Monitor when the oscillator crosses the EMA. A crossover from below to above suggests a buy, while a crossunder from above to below suggests a sell.
- **Confirm with Other Indicators**: For more reliable signals, consider using this indicator alongside other technical tools like volume analysis, trend lines, or support/resistance levels.
This indicator is ideal for traders looking to capture momentum-based trades in various market conditions.
The **Price Oscillator with EMA** is a custom technical analysis tool designed to help traders identify potential buying and selling opportunities based on price momentum. Here's how to use it:
1. **Understanding the Oscillator**:
- The oscillator is calculated by normalizing the current price relative to the highest high and lowest low over a specified lookback period. It fluctuates between -70 and +70.
- When the oscillator is near +70, the price is close to the recent highs, indicating potential overbought conditions. Conversely, when it’s near -100, the price is close to recent lows, indicating potential oversold conditions.
2. **Exponential Moving Average (EMA)**:
- The indicator includes an EMA of the oscillator to smooth out price fluctuations and provide a clearer signal.
- The EMA helps to filter out noise and confirm trends.
3. **Trading Signals**:
- **Bullish Signal**: A potential buying opportunity is signaled when the oscillator crosses above its EMA. This suggests increasing upward momentum.
- **Bearish Signal**: A potential selling opportunity is signaled when the oscillator crosses below its EMA. This indicates increasing downward momentum.
4. **Visual Aids**:
- The indicator includes horizontal lines at +70, 0, and -70 to help you quickly assess overbought, neutral, and oversold conditions.
- The blue line represents the oscillator, while the orange line represents the EMA of the oscillator.
### How to Use:
- **Set your parameters**: Adjust the lookback period and EMA length to fit your trading strategy and time frame.
- **Watch for Crossovers**: Monitor when the oscillator crosses the EMA. A crossover from below to above suggests a buy, while a crossunder from above to below suggests a sell.
- **Confirm with Other Indicators**: For more reliable signals, consider using this indicator alongside other technical tools like volume analysis, trend lines, or support/resistance levels.
This indicator is ideal for traders looking to capture momentum-based trades in various market conditions.
Skrip sumber terbuka
Dalam semangat TradingView sebenar, pencipta skrip ini telah menjadikannya sumber terbuka, jadi pedagang boleh menilai dan mengesahkan kefungsiannya. Terima kasih kepada penulis! Walaupuan anda boleh menggunakan secara percuma, ingat bahawa penerbitan semula kod ini tertakluk kepada Peraturan Dalaman.
Penafian
Maklumat dan penerbitan adalah tidak bertujuan, dan tidak membentuk, nasihat atau cadangan kewangan, pelaburan, dagangan atau jenis lain yang diberikan atau disahkan oleh TradingView. Baca lebih dalam Terma Penggunaan.