OPEN-SOURCE SCRIPT
Telah dikemas kini Stochastic RSI Bands
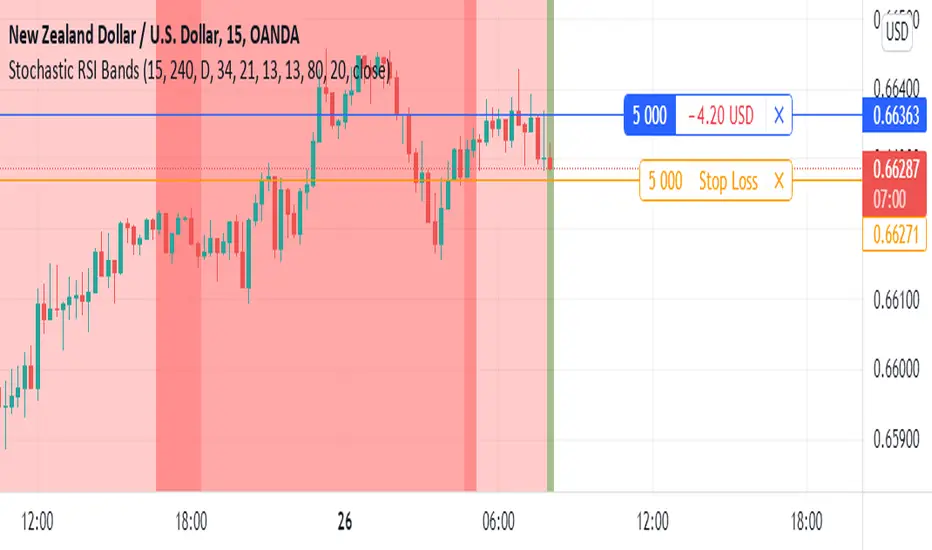
Stochastic RSI Bands by // © drbarry92064859
It is suggested to view this indicator on 15m or 5m timeframe with current Default Settings.
This indicator is based on the StochRsi.
It creates color bands based on the direction of multiple timeframe StochRsi.
When the MTF StochRsi's are opposed in direction it produces darker bands and when aligned in direction it produces light bands.
During Green Bands, price tends to be Bullish. During Red Bands, price tends to be Bearish.
During Medium toned Bands, price action tends to be in a correction in existing HTF trend, ranging, or getting ready for reversal.
During Light Bands, price tends to be in Trend in direction of color.
There is usually Dark Bands on either side of a light or medium toned band.
Best to enter in direction of current color, during the dark band after the medium toned bands
And exit in the dark band after the light toned band.
Brown bands tend to indicate reversal of direction and color.
I have experimented with all the timeframes and StochRSI settings and found the best settings to be as follows.
The Default settings are Middle Time Frame: 4H and Higher TimeFrame: D1.
The Default StochRSI settings are 34 RSI, 21 Stochastic, 13 smooth K and 13 smooth D.
It is suggested to use a lower timeframe such as 15m or 5m for entry.
You can experiment with different StochRSI and TimeFrame Settings.
SUGGESTED STRATEGY
Dark Bands after medium toned bands: Look for an entry on lower timeframe (15m or 5m) based on reversal candlestick formations or other indicators in direction of current color.
Light Bands: Do not enter during lighter bands. You should already be in trade during Light Bands
Light Band changes to Dark Band: Exit Trade if already in.
Look for general change of directional bias if a brown band occurs; however wait for dark band after the 2nd wide band following the brown band.
Nota Keluaran
Stochastic RSI Bands by // © drbarry92064859It is suggested to view this indicator on 15m or 5m timeframe with current Default Settings.
This indicator is based on the StochRsi.
It creates color bands based on the direction of multiple timeframe StochRsi.
When the MTF StochRsi's are opposed in direction it produces darker bands and when aligned in direction it produces light bands.
During Green Bands, price tends to be Bullish . During Red Bands, price tends to be Bearish .
During Medium toned Bands, price action tends to be in a correction in existing HTF trend, ranging, or getting ready for reversal.
During Light Bands, price tends to be in Trend in direction of color.
There is usually Dark Bands on either side of a light or medium toned band.
Best to enter in direction of current color, during the dark band after the medium toned bands
And exit in the dark band after the light toned band.
Brown bands tend to indicate reversal of direction and color.
I have experimented with all the timeframes and StochRSI settings and found the best settings to be as follows.
The Default settings are Middle Time Frame: 4H and Higher TimeFrame: D1.
The Default StochRSI settings are 34 RSI , 21 Stochastic , 13 smooth K and 13 smooth D.
It is suggested to use a lower timeframe such as 15m or 5m for entry.
You can experiment with different StochRSI and TimeFrame Settings.
SUGGESTED STRATEGY
Dark Bands after medium toned bands: Look for an entry on lower timeframe (15m or 5m) based on reversal candlestick formations or other indicators in direction of current color.
Light Bands: Do not enter during lighter bands. You should already be in trade during Light Bands
Light Band changes to Dark Band: Exit Trade if already in.
Look for general change of directional bias if a brown band occurs; however wait for dark band after the 2nd wide band following the brown band.
Skrip sumber terbuka
Dalam semangat TradingView sebenar, pencipta skrip ini telah menjadikannya sumber terbuka, jadi pedagang boleh menilai dan mengesahkan kefungsiannya. Terima kasih kepada penulis! Walaupuan anda boleh menggunakan secara percuma, ingat bahawa penerbitan semula kod ini tertakluk kepada Peraturan Dalaman.
Penafian
Maklumat dan penerbitan adalah tidak bertujuan, dan tidak membentuk, nasihat atau cadangan kewangan, pelaburan, dagangan atau jenis lain yang diberikan atau disahkan oleh TradingView. Baca lebih dalam Terma Penggunaan.