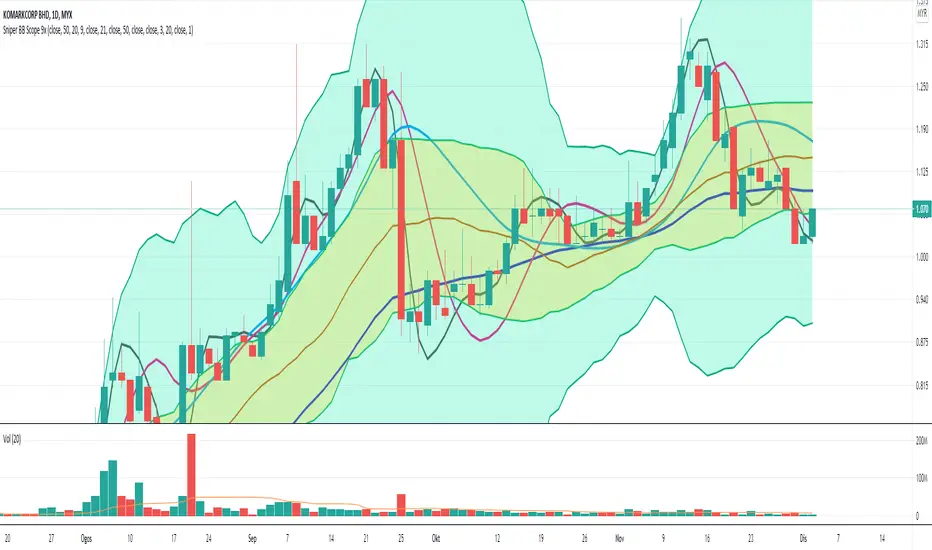
Sniper BB Scope 9x v2.0
1- BB
2- HMA
Component of BB and the improvement
- combining two BB with different standard deviation that will help trader to identify the range of the price movement. The BB seperate by different colors background so that will help trader to easyly find the price trend.
1. Outer BB - dark green background with dark green line boundaries
- bb breakout with volume if reach the upper bb will have potential to surfing upper BB. But please double confirm with others indi for the momentum. If reach peak, then possible to going back to Upper Inner BB or mid BB.
2. Inner BB - yellow background with light green line boundaries
- can act as nearest support if price going retrace from upper BB. Sometime, the price retrace a bit and making support here before push to higher price.
3. Black line
- cross up candle can buy
- cross down candle can sell
4. Red line
- cross up candle can buy
- cross down candle can sell
5. Blue line act as strong support and resistant for the long term position
- If candle trading below blue line, the blue line will act as resistant.
- If candle trading above blue line, the blue line will act as support.
The signal indication
Strong buy signal
When both black and red line cross up the blue line.
Strong sell signal
When both black and red line line cross down the blue line.
- revised more accurate multiple hma calculation
Skrip jemputan sahaja
Hanya pengguna yang diluluskan oleh penulis boleh mengakses skrip ini. Anda perlu memohon dan mendapatkan kebenaran untuk menggunakannya. Ini selalunya diberikan selepas pembayaran. Untuk lebih butiran, ikuti arahan penulis di bawah atau hubungi terus bids_sniper.
TradingView tidak menyarankan pembayaran untuk atau menggunakan skrip kecuali anda benar-benar mempercayai penulisnya dan memahami bagaimana ia berfungsi. Anda juga boleh mendapatkan alternatif sumber terbuka lain yang percuma dalam skrip komuniti kami.
Arahan penulis
Amaran: sila baca panduan kami untuk skrip jemputan sahaja sebelum memohon akses.
Penafian
Skrip jemputan sahaja
Hanya pengguna yang diluluskan oleh penulis boleh mengakses skrip ini. Anda perlu memohon dan mendapatkan kebenaran untuk menggunakannya. Ini selalunya diberikan selepas pembayaran. Untuk lebih butiran, ikuti arahan penulis di bawah atau hubungi terus bids_sniper.
TradingView tidak menyarankan pembayaran untuk atau menggunakan skrip kecuali anda benar-benar mempercayai penulisnya dan memahami bagaimana ia berfungsi. Anda juga boleh mendapatkan alternatif sumber terbuka lain yang percuma dalam skrip komuniti kami.
Arahan penulis
Amaran: sila baca panduan kami untuk skrip jemputan sahaja sebelum memohon akses.