PROTECTED SOURCE SCRIPT
MACD MTF

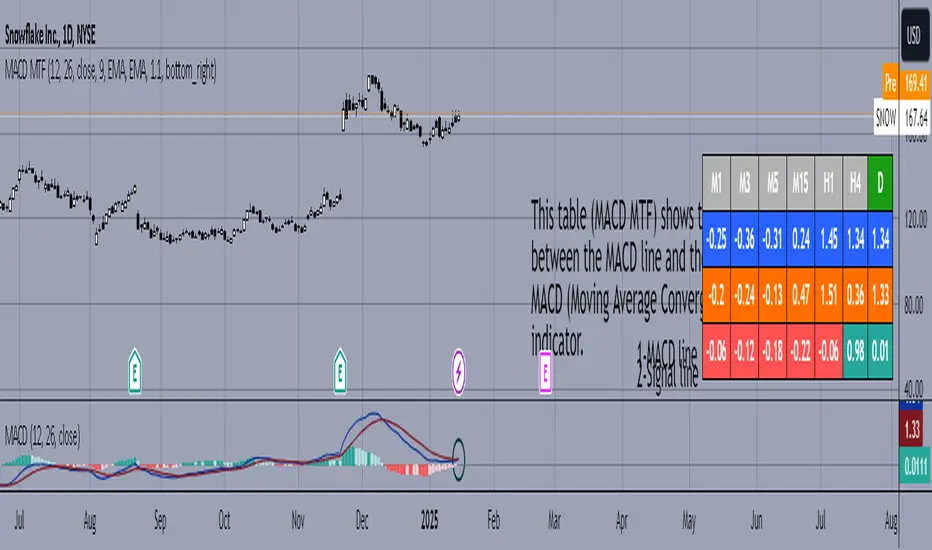
This table is a technical indicator that shows the proximity between the MACD line and the signal line of the multitemporal MACD (Moving Average Convergence Divergence) indicator. When the crossover is bullish, the timeframe will light up in green, and vice versa, if the crossover is bearish, the timeframe will light up in red. With this table, we can save time when detecting opportunities, as with one glance, we can spot potential MACD crossovers (which tend to indicate price action inflection points).
Esta tabla es un indicador técnico que muestra la proximidad entre la línea MACD y la línea de señal del indicador MACD (Moving Average Convergence Divergence) multitemporalmente. Cuando el cruce es alcista la temporalidad se iluminará en verde, y viceversa, si el cruce es bajista la temporalidad se iluminará en rojo. Con esta tabla podremos ahorrar tiempo a la hora de detectar oportunidades, pues de un vistazo podremos detectar posibles cruces de MACD (tienden a señalar puntos de inflexión en la acción de precio)
Esta tabla es un indicador técnico que muestra la proximidad entre la línea MACD y la línea de señal del indicador MACD (Moving Average Convergence Divergence) multitemporalmente. Cuando el cruce es alcista la temporalidad se iluminará en verde, y viceversa, si el cruce es bajista la temporalidad se iluminará en rojo. Con esta tabla podremos ahorrar tiempo a la hora de detectar oportunidades, pues de un vistazo podremos detectar posibles cruces de MACD (tienden a señalar puntos de inflexión en la acción de precio)
Skrip dilindungi
Skrip ini diterbitkan sebagai sumber tertutup. Akan tetapi, anda boleh menggunakannya secara bebas dan tanpa apa-apa had – ketahui lebih di sini.
📖Revista El Especulador:
drive.google.com/file/d/1Fs8l9xSpZIy5haCb5l0HWzgeAanOifs_/view?usp=drivesdk
👉t.me/ElEspeculador96 (Telegram)
drive.google.com/file/d/1Fs8l9xSpZIy5haCb5l0HWzgeAanOifs_/view?usp=drivesdk
👉t.me/ElEspeculador96 (Telegram)
Penafian
Maklumat dan penerbitan adalah tidak bertujuan, dan tidak membentuk, nasihat atau cadangan kewangan, pelaburan, dagangan atau jenis lain yang diberikan atau disahkan oleh TradingView. Baca lebih dalam Terma Penggunaan.