OPEN-SOURCE SCRIPT
Армс Индекс (TRIN)
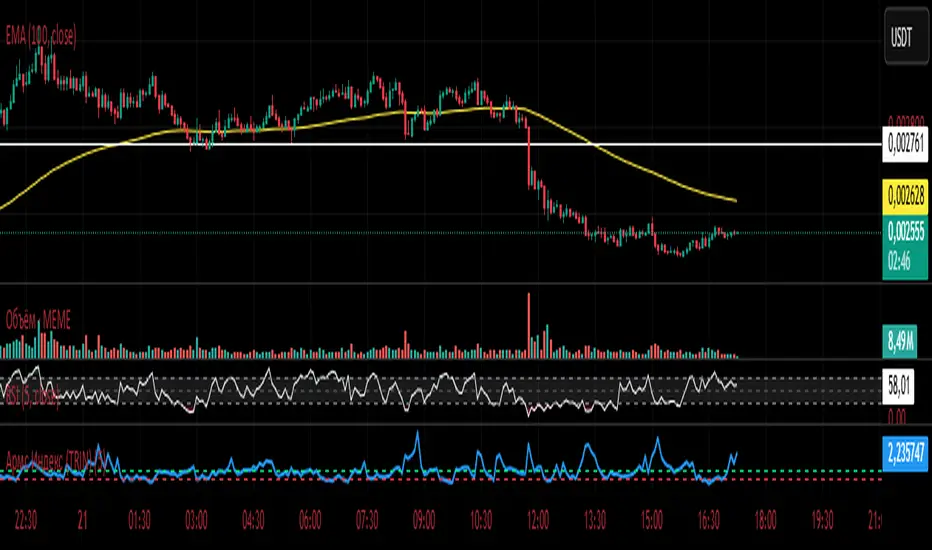
Arms Indicator (TRIN)
General description
This indicator is designed to visualize the overbought and oversold levels of the stock market. The Arms Index (TRIN) evaluates the ratio of the number of rising and falling stocks to the corresponding ratio of the trading volume of rising and falling stocks. The lower the TRIN indicator, the more overbought the market is, and vice versa — a high TRIN indicates oversold conditions.
How to interpret the signal?
- Zone below 0.8: The market is overbought, and a downward correction is likely to follow soon.
- Zone above 1.2: The market is oversold, an upward reversal is possible.
These zones help to identify entry and exit points in a timely manner, optimizing trading decisions.
Implementation features
1. Calculation method: The classic TRIN formula is based on the ratio of volume indicators of rising and falling assets.
2. Averaging interval: A moving average (MA) is used with a configurable default period of five days. The user can change this value manually.
3. Level display: The chart shows two key levels: the oversold (1.2) and overbought (0.8) lines. These lines are guidelines for decision-making.
Instructions for use
1. Upload the indicator to the chart of your financial instrument.
2. Keep an eye on the TRIN value: does it cross the critical levels (1.2 and 0.8)?
3. Use the TRIN readings as an additional filter to confirm the signal of your main strategies.
Remember that the Arms index is best used in conjunction with other technical analysis indicators to achieve maximum signal accuracy.
---
I hope this implementation will help you to trade more efficiently and find the best opportunities in the market!
© The authorship belongs to Eva-S-Apple.
Skrip sumber terbuka
Dalam semangat TradingView sebenar, pencipta skrip ini telah menjadikannya sumber terbuka, jadi pedagang boleh menilai dan mengesahkan kefungsiannya. Terima kasih kepada penulis! Walaupuan anda boleh menggunakan secara percuma, ingat bahawa penerbitan semula kod ini tertakluk kepada Peraturan Dalaman.
Penafian
Maklumat dan penerbitan adalah tidak bertujuan, dan tidak membentuk, nasihat atau cadangan kewangan, pelaburan, dagangan atau jenis lain yang diberikan atau disahkan oleh TradingView. Baca lebih dalam Terma Penggunaan.