OPEN-SOURCE SCRIPT
Trade Life Balance Multi EMA
The Trade Life Balance EMA Indicator is a versatile and essential tool for technical analysts and traders. It combines five of the most commonly used Exponential Moving Averages (EMAs) into a single indicator, and additionally offers two optional EMAs for advanced analysis. This indicator helps to quickly identify trend direction, dynamic support and resistance levels, and potential entry and exit points.
Important Note:
Moving averages are lagging indicators, meaning they are based on past price data and do not predict future price movements. For a comprehensive market analysis, it is highly recommended to use the TLB EMA indicator in combination with other analytical tools such as volume, price action, and oscillators.
How the TLB EMA Indicator Works
The indicator plots multiple Exponential Moving Averages directly on the price chart. An EMA is a type of moving average that gives more weight and significance to the most recent price data, making it more responsive to price changes than a Simple Moving Average (SMA).
Default Configuration:
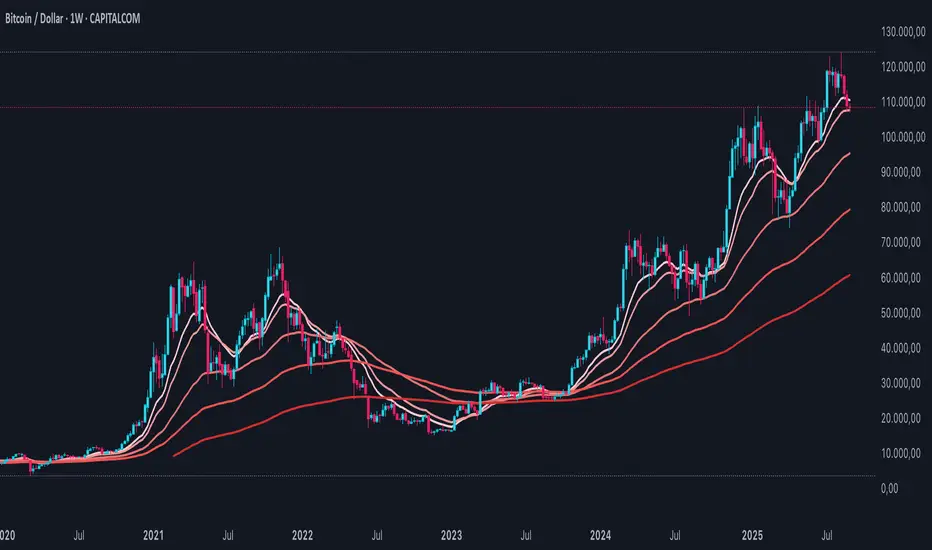
The indicator comes pre-configured with five core EMAs that play a crucial role in many trading strategies:
The color scheme, ranging from light red (fastest EMA) to dark red (slowest EMA), facilitates quick visual identification.
Customization Options
The TLB EMA indicator is fully customizable to suit individual trading strategies and preferences:
Advantages of the TLB EMA Indicator
Using the TLB EMA Indicator
The TLB EMA can be used in various ways in trading:
Please note that the TLB EMA indicator is a tool for analysis and does not guarantee profitable trades. Always use it in conjunction with a solid risk management strategy.
Important Note:
Moving averages are lagging indicators, meaning they are based on past price data and do not predict future price movements. For a comprehensive market analysis, it is highly recommended to use the TLB EMA indicator in combination with other analytical tools such as volume, price action, and oscillators.
How the TLB EMA Indicator Works
The indicator plots multiple Exponential Moving Averages directly on the price chart. An EMA is a type of moving average that gives more weight and significance to the most recent price data, making it more responsive to price changes than a Simple Moving Average (SMA).
Default Configuration:
The indicator comes pre-configured with five core EMAs that play a crucial role in many trading strategies:
- EMA 13 & 20: Often used as short-term trend indicators. Their slope and the distance to the price can indicate the strength of the current momentum.
- EMA 50: Considered an important mid-term trend indicator. A price holding above the 50 EMA often suggests a healthy uptrend.
- EMA 100: Serves as a mid- to long-term trend filter.
- EMA 200: Widely regarded as the decisive line between a long-term bull and bear market.
The color scheme, ranging from light red (fastest EMA) to dark red (slowest EMA), facilitates quick visual identification.
Customization Options
The TLB EMA indicator is fully customizable to suit individual trading strategies and preferences:
- EMA Lengths: All five standard EMAs, as well as the two optional ones, can be set to any desired length in the "Inputs" settings.
- Optional EMAs: Two additional EMAs are disabled by default. They can be activated via a checkbox to supplement the analysis with other user-defined periods (e.g., for Fibonacci numbers or specific strategies).
- Visual Style: In the "Style" tab of the indicator settings, the color, thickness, and visibility of each individual EMA line can be adjusted as desired.
Advantages of the TLB EMA Indicator
- All-in-One Solution: Consolidates the most important EMAs into a single indicator, keeping the chart view clean and eliminating the need to add multiple individual indicators.
- High Flexibility: With fully customizable lengths and two optional EMAs, the indicator can be configured for any strategy and any market (stocks, forex, crypto, etc.).
- Visual Clarity: The pre-configured color coding allows for an intuitive and quick interpretation of the different trend speeds.
- Efficiency: Saves time in chart setup and analysis.
Using the TLB EMA Indicator
The TLB EMA can be used in various ways in trading:
- Trend Identification: The simplest application is to determine the overall trend. If the price is above the EMAs (especially the 200), it indicates an uptrend. If it is below, the trend is downward.
- Dynamic Support and Resistance: In an uptrend, the EMAs often act as dynamic support zones where the price can bounce. In a downtrend, they serve as dynamic resistance zones.
- Crossover Signals: The crossing of EMAs can generate trading signals. A "Golden Cross" (e.g., the 50 EMA crosses above the 200 EMA) is considered a bullish signal, while a "Death Cross" (50 EMA crosses below the 200 EMA) is considered a bearish signal.
Please note that the TLB EMA indicator is a tool for analysis and does not guarantee profitable trades. Always use it in conjunction with a solid risk management strategy.
Skrip sumber terbuka
Dalam semangat sebenar TradingView, pencipta skrip ini telah menjadikannya sumber terbuka supaya pedagang dapat menilai dan mengesahkan kefungsiannya. Terima kasih kepada penulis! Walaupun anda boleh menggunakannya secara percuma, ingat bahawa menerbitkan semula kod ini adalah tertakluk kepada Peraturan Dalaman kami.
Penafian
Maklumat dan penerbitan adalah tidak dimaksudkan untuk menjadi, dan tidak membentuk, nasihat untuk kewangan, pelaburan, perdagangan dan jenis-jenis lain atau cadangan yang dibekalkan atau disahkan oleh TradingView. Baca dengan lebih lanjut di Terma Penggunaan.