OPEN-SOURCE SCRIPT
Andean Oscillator (Version 3.0 Sr.K)
Andean Oscillator (Version 3.0 Sr.K)
This indicator is a momentum-based oscillator that measures the balance between bullish and bearish pressure.
🔧 How it works:
It calculates two adaptive envelopes around price and derives a "bullish" and "bearish" component.
The oscillator value is simply Bull - Bear, showing which side dominates.
A signal line (EMA of the oscillator) smooths the raw value.
Optionally, ±1σ levels are plotted to highlight statistically strong moves.
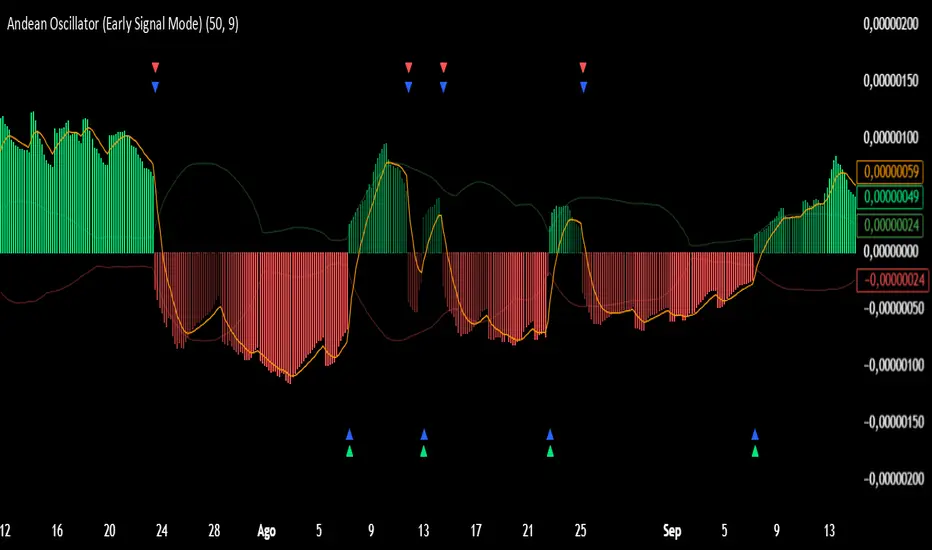
📊 What you see:
Histogram: Positive bars = bullish momentum, negative bars = bearish.
Orange Line: Signal line (EMA) used to confirm or anticipate reversals.
Zero Line: The equilibrium point. Crosses of this level signal a shift in market bias.
Green / Red Triangles: Buy and sell signals, either when crossing zero or crossing the signal line (depending on selected mode).
⚡ Early Signal Mode:
When enabled, signals trigger earlier — at the crossover between the oscillator and its signal line — allowing traders to enter potential reversals before a full zero-cross confirmation.
✅ Use cases:
Identify momentum shifts before price reversals.
Spot potential long/short setups with reduced lag.
Combine with price action or support/resistance for confirmation.
⚠️ Note: This is a tool for discretionary/manual trading. It does not open or close trades automatically. Always confirm with your own analysis and risk management.
This indicator is a momentum-based oscillator that measures the balance between bullish and bearish pressure.
🔧 How it works:
It calculates two adaptive envelopes around price and derives a "bullish" and "bearish" component.
The oscillator value is simply Bull - Bear, showing which side dominates.
A signal line (EMA of the oscillator) smooths the raw value.
Optionally, ±1σ levels are plotted to highlight statistically strong moves.
📊 What you see:
Histogram: Positive bars = bullish momentum, negative bars = bearish.
Orange Line: Signal line (EMA) used to confirm or anticipate reversals.
Zero Line: The equilibrium point. Crosses of this level signal a shift in market bias.
Green / Red Triangles: Buy and sell signals, either when crossing zero or crossing the signal line (depending on selected mode).
⚡ Early Signal Mode:
When enabled, signals trigger earlier — at the crossover between the oscillator and its signal line — allowing traders to enter potential reversals before a full zero-cross confirmation.
✅ Use cases:
Identify momentum shifts before price reversals.
Spot potential long/short setups with reduced lag.
Combine with price action or support/resistance for confirmation.
⚠️ Note: This is a tool for discretionary/manual trading. It does not open or close trades automatically. Always confirm with your own analysis and risk management.
Skrip sumber terbuka
Dalam semangat TradingView sebenar, pencipta skrip ini telah menjadikannya sumber terbuka, jadi pedagang boleh menilai dan mengesahkan kefungsiannya. Terima kasih kepada penulis! Walaupuan anda boleh menggunakan secara percuma, ingat bahawa penerbitan semula kod ini tertakluk kepada Peraturan Dalaman.
Penafian
Maklumat dan penerbitan adalah tidak bertujuan, dan tidak membentuk, nasihat atau cadangan kewangan, pelaburan, dagangan atau jenis lain yang diberikan atau disahkan oleh TradingView. Baca lebih dalam Terma Penggunaan.