OPEN-SOURCE SCRIPT
Telah dikemas kini RVol Over Time [vnhilton]
I recommend to do the following to give you indicator values at a better glance & for a cleaner chart: 1) Turn off labels on price scale. 2) Turn down opacity for Rvol-O-T down to 0%. 3) Move the indicator to the chart pane or to the volume pane. 4) Pin the indicator to scale A (same scale as the price chart/pane). Now you can only see the RVol-O-T on the top left.
Relative Volume (RVol) is an indicator that compares current volume with Average Daily Volume (ADV) for a set period of time. This can be used to find tickers in play, as those trading with an RVol >1 means it's trading above average volume, which may be worthy of your attention.
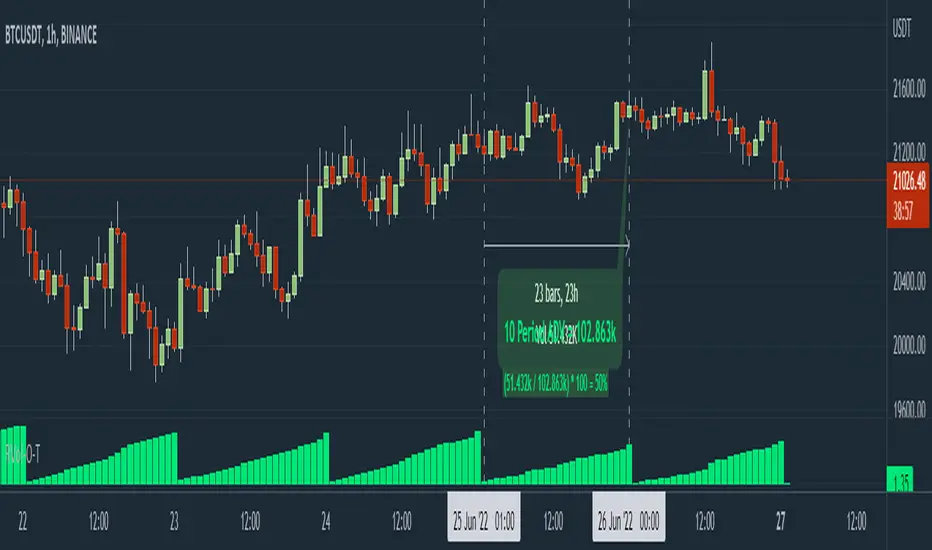
This indicator calculates RVol as the day progresses, which may be useful if you have strategies with an intraday criterion e.g. the ticker needs to be trading at Rvol > 2, 30 minutes after the open for stocks (You can see RVol in % or float form).
The chart snapshot image above shows BTCUSDT. Reason for this ticker is because for cryptocurrencies & forex pairs, market data is complete so this indicator can work correctly. If you try this indicator on stocks, indices or futures, you may notice that there's a discrepancy between daily volume candles & the summation of intraday candles (they don't equate each other - huge difference between the 2), causing the indicator to not work as effectively. To solve this problem, you would have to get extra market data from TradingView, or to integrate your broker with TradingView to pass along your broker's data feed (provided your broker also has real-time data - if not you may need to get extra market data via the broker).
Relative Volume (RVol) is an indicator that compares current volume with Average Daily Volume (ADV) for a set period of time. This can be used to find tickers in play, as those trading with an RVol >1 means it's trading above average volume, which may be worthy of your attention.
This indicator calculates RVol as the day progresses, which may be useful if you have strategies with an intraday criterion e.g. the ticker needs to be trading at Rvol > 2, 30 minutes after the open for stocks (You can see RVol in % or float form).
The chart snapshot image above shows BTCUSDT. Reason for this ticker is because for cryptocurrencies & forex pairs, market data is complete so this indicator can work correctly. If you try this indicator on stocks, indices or futures, you may notice that there's a discrepancy between daily volume candles & the summation of intraday candles (they don't equate each other - huge difference between the 2), causing the indicator to not work as effectively. To solve this problem, you would have to get extra market data from TradingView, or to integrate your broker with TradingView to pass along your broker's data feed (provided your broker also has real-time data - if not you may need to get extra market data via the broker).
Nota Keluaran
- Removed option to display RVol in % (float value I believe is superior when describing RVol e.g. 1x, 2x 3x average daily volume)- Change default plot style to line for aesthetics
- Added 3 RVol Multiple levels for quicker information on RVol
Nota Keluaran
- Added rate of change (1 period) colors for relative volume to see whether or not RVOL is accelerating/decelerating over time. Useful when sizing into trends with supporting accelerated RVOL, & taking profit when RVOL decelerates.Nota Keluaran
-Edited shorttitle-Added feature to choose ROC length for RVOL-OT
Skrip sumber terbuka
Dalam semangat TradingView sebenar, pencipta skrip ini telah menjadikannya sumber terbuka, jadi pedagang boleh menilai dan mengesahkan kefungsiannya. Terima kasih kepada penulis! Walaupuan anda boleh menggunakan secara percuma, ingat bahawa penerbitan semula kod ini tertakluk kepada Peraturan Dalaman.
Penafian
Maklumat dan penerbitan adalah tidak bertujuan, dan tidak membentuk, nasihat atau cadangan kewangan, pelaburan, dagangan atau jenis lain yang diberikan atau disahkan oleh TradingView. Baca lebih dalam Terma Penggunaan.