OPEN-SOURCE SCRIPT
Telah dikemas kini Secondary Chart with OverSized Candles
Hi everyone, I'm sharing a simple script I made for a friend. He was looking for a way to add another asset to his chart, and monitor relevant movements \ spot eventual correlation, especially when trading Cryptocurrencies.
We couldn't find a similar script already available so here it is - the code is commented and I hope it's clear enough :)
Notes:
- The parameter scale = scale.left keeps the scales separated and therefore the chart is more organized, otherwise the chart would appear flat if the price difference is too big (e.g. BTC vs XRP)
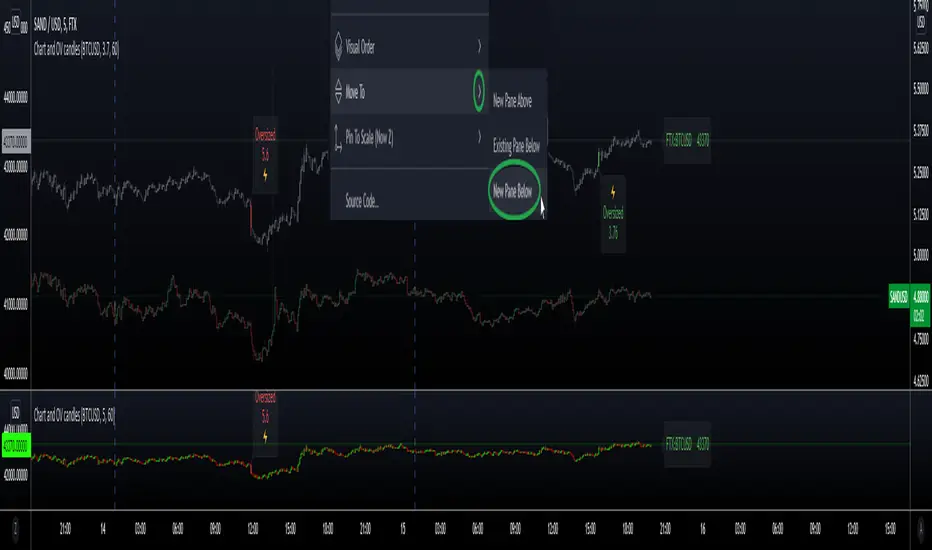
- It is possible to have the script running in a separate panel (instead of overlay) by moving it to a new pane (when added to the chart) or by removing the parameter overlay = true at the beginning of the code.
- In case you wish to add indicators to this sub-chart (e.g. Bollinger Bands, EMA, etc..) you can do that by adding the relevant code and feed it with the variables OPEN \ HIGH \ LOW \ CLOSE as well as using the same method to retrieve new variables from the target asset with the request.security function.
Hope this comes handy.
Val - Protervus
We couldn't find a similar script already available so here it is - the code is commented and I hope it's clear enough :)
Notes:
- The parameter scale = scale.left keeps the scales separated and therefore the chart is more organized, otherwise the chart would appear flat if the price difference is too big (e.g. BTC vs XRP)
- It is possible to have the script running in a separate panel (instead of overlay) by moving it to a new pane (when added to the chart) or by removing the parameter overlay = true at the beginning of the code.
- In case you wish to add indicators to this sub-chart (e.g. Bollinger Bands, EMA, etc..) you can do that by adding the relevant code and feed it with the variables OPEN \ HIGH \ LOW \ CLOSE as well as using the same method to retrieve new variables from the target asset with the request.security function.
Hope this comes handy.
Val - Protervus
Nota Keluaran
Added Price Line as per request (can be disabled in Settings)Nota Keluaran
Code-cleaning only.Nota Keluaran
Fixed the alert for Bearish OverSized CandleSkrip sumber terbuka
Dalam semangat TradingView sebenar, pencipta skrip ini telah menjadikannya sumber terbuka, jadi pedagang boleh menilai dan mengesahkan kefungsiannya. Terima kasih kepada penulis! Walaupuan anda boleh menggunakan secara percuma, ingat bahawa penerbitan semula kod ini tertakluk kepada Peraturan Dalaman.
Penafian
Maklumat dan penerbitan adalah tidak bertujuan, dan tidak membentuk, nasihat atau cadangan kewangan, pelaburan, dagangan atau jenis lain yang diberikan atau disahkan oleh TradingView. Baca lebih dalam Terma Penggunaan.
Skrip sumber terbuka
Dalam semangat TradingView sebenar, pencipta skrip ini telah menjadikannya sumber terbuka, jadi pedagang boleh menilai dan mengesahkan kefungsiannya. Terima kasih kepada penulis! Walaupuan anda boleh menggunakan secara percuma, ingat bahawa penerbitan semula kod ini tertakluk kepada Peraturan Dalaman.
Penafian
Maklumat dan penerbitan adalah tidak bertujuan, dan tidak membentuk, nasihat atau cadangan kewangan, pelaburan, dagangan atau jenis lain yang diberikan atau disahkan oleh TradingView. Baca lebih dalam Terma Penggunaan.