OPEN-SOURCE SCRIPT
Shadow Edge (Example)
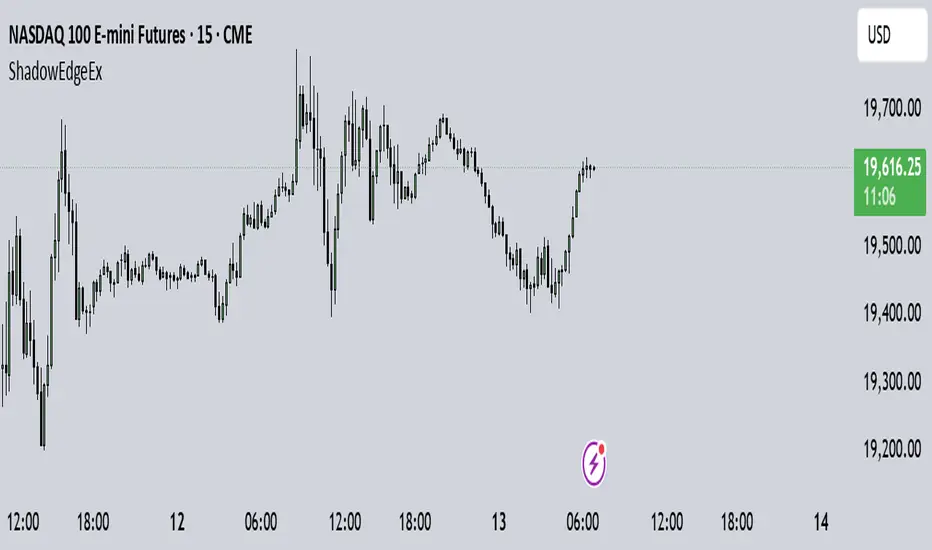
This script tracks hourly price extremes (highs/lows) and their equilibrium (midpoint), plotting them as dynamic reference lines on your chart. It helps visualize intraday support/resistance levels and potential price boundaries.
Key Features
Previous Hour Levels (Static Lines):
PH (Previous Hour High): Red line.
PL (Previous Hour Low): Green line.
P.EQ (Previous Hour Equilibrium): Blue midpoint between PH and PL.
Current Hour Levels (Dynamic/Dotted Lines):
MuEH (Current Hour High): Yellow dashed line (updates in real-time).
MuEL (Current Hour Low): Orange dashed line (updates in real-time).
Labels: Clear text labels on the right edge of the chart for easy readability.
How It Works
Hourly Tracking:
Detects new hours using the hour(time) function.
Resets high/low values at the start of each hour.
Stores the previous hour’s PH, PL, and P.EQ when a new hour begins.
Dynamic Updates:
Continuously updates MuEH and MuEL during the current hour to reflect the latest extremes.
Customization
Toggle visibility of lines via inputs:
Enable/disable PH, PL, P.EQ, MuEH, MuEL individually.
Adjustable colors and line styles (solid for previous hour, dashed for current hour).
Use Case
Intraday Traders: Identify hourly ranges, breakout/retracement opportunities, or mean-reversion setups.
Visual Reference: Quickly see where price is relative to recent hourly activity.
Technical Notes
Overlay: Plots directly on the price chart.
Efficiency: Uses var variables to preserve values between bars.
Labels: Only appear on the latest bar to avoid clutter.
This tool simplifies intraday price action analysis by combining historical and real-time hourly data into a single visual framework.
Skrip sumber terbuka
Dalam semangat TradingView sebenar, pencipta skrip ini telah menjadikannya sumber terbuka, jadi pedagang boleh menilai dan mengesahkan kefungsiannya. Terima kasih kepada penulis! Walaupuan anda boleh menggunakan secara percuma, ingat bahawa penerbitan semula kod ini tertakluk kepada Peraturan Dalaman.
Penafian
Maklumat dan penerbitan adalah tidak bertujuan, dan tidak membentuk, nasihat atau cadangan kewangan, pelaburan, dagangan atau jenis lain yang diberikan atau disahkan oleh TradingView. Baca lebih dalam Terma Penggunaan.