OPEN-SOURCE SCRIPT
Telah dikemas kini SENTIMENT
SENTIMENT Indicator – User Guide
Summary
The SENTIMENT indicator provides a quick visual reference for current and recent market sentiment. It compares the closing price to a custom sentiment value, which is the average of the 100-period (default) simple moving averages (SMA) of the high and low prices. The indicator displays this information in a color-coded table and plots the difference between price and sentiment as a line on your chart.
How to Use
1. Table Overview
The table appears on your chart in your chosen position.
It displays four rows: the current bar (“Now”) and the previous three bars (“Bar -1”, “Bar -2”, “Bar -3”).
Each row shows:
The bar label (The current bar is live and active, constantly changing)
The closing price for that bar
The difference between the closing price and the sentiment value for that bar
The sentiment difference is color-coded:
Green: Price is above sentiment (bullish)
Red: Price is below sentiment (bearish)
2. Chart Plot
The indicator plots a line showing the difference between the current price and the sentiment value.
When the line is above zero: price is above sentiment (bullish).
When the line is below zero: price is below sentiment (bearish).
3. Settings
Number of Lookback Bars: Adjusts the SMA period for sentiment calculation (default is 100).
Table Position: Choose where to display the table on your chart (e.g., Top Left, Bottom Right).
How to Interpret
Green values in the table or a plot above zero suggest bullish sentiment.
Red values in the table or a plot below zero suggest bearish sentiment.
Use this indicator to quickly assess if the market is trading above or below its recent average sentiment level.
Tips
You can combine the SENTIMENT indicator with other tools or signals for more robust trading decisions.
Adjust the lookback period to suit your trading timeframe and style.
Nota Keluaran
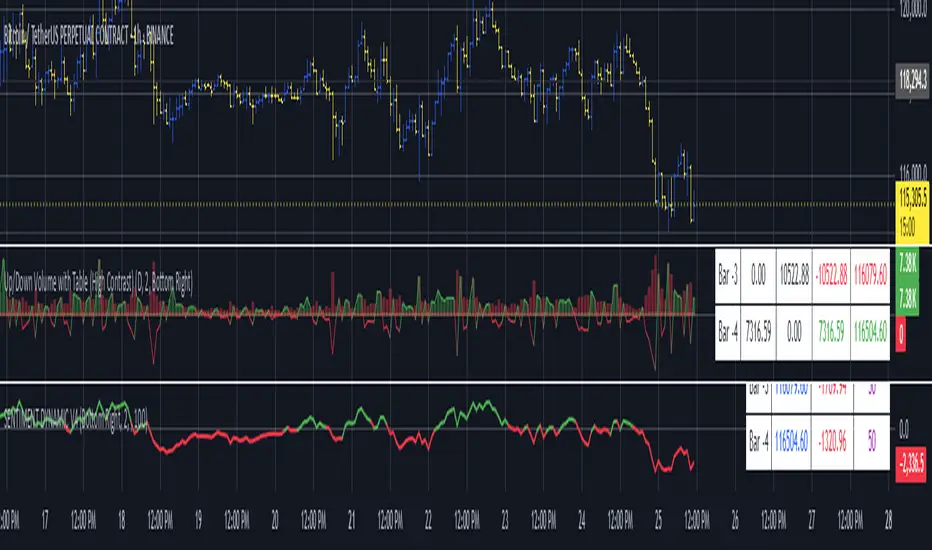
UPDATE: Script Summary“SENTIMENT DYNAMIC V3” is a custom Pine Script indicator designed to measure and visualize price sentiment using dynamic or static lookback periods. The script calculates a “sentiment” value based on the average of the high and low Simple Moving Averages (SMA) over a configurable lookback window. This lookback can be dynamically adjusted based on recent price volatility (standard deviation) or set to a fixed length by the user.
The indicator displays:
A table showing the sentiment data for the current and previous three bars, including bar label, price, sentiment difference, and lookback period.
A plot of the difference between the current close price and the calculated sentiment line, colored green for positive sentiment and red for negative sentiment.
User Instructions
Add the Indicator:
Paste the script into TradingView’s Pine Script editor.
Add the script to your chart.
Configure Inputs:
Table Position: Select where the sentiment table appears on your chart (e.g., Bottom Right).
Enable Dynamic Lookback:
If checked, the script adjusts the lookback period based on recent volatility.
If unchecked, the script uses the static lookback period.
Static Lookback:
Set the number of bars for sentiment calculation when dynamic lookback is disabled.
Read the Table:
The table displays four rows (Now, Bar -1, Bar -2, Bar -3).
Columns show:
Bar: Label for each bar.
Price: Closing price for that bar.
SENTIMENT: Difference between the close and sentiment value (green if positive, red if negative).
Lookback: The actual lookback period used for each bar.
Interpret the Plot:
The plot below the chart shows the sentiment difference (close minus sentiment).
Green line: Indicates price is above sentiment (bullish).
Red line: Indicates price is below sentiment (bearish).
How to Interpret the Results
Sentiment Value:
The sentiment is an average of the high and low SMAs over the lookback period. It acts as a dynamic support/resistance or fair value zone.
Sentiment Difference (Close - Sentiment):
Positive (Green): Price is trading above sentiment, suggesting bullish momentum or positive sentiment.
Negative (Red): Price is trading below sentiment, suggesting bearish momentum or negative sentiment.
Magnitude: The larger the absolute value, the stronger the deviation from the sentiment line, which may indicate overbought/oversold conditions.
Dynamic vs. Static Lookback:
Dynamic: The lookback period shortens during high volatility and lengthens during low volatility, making sentiment more responsive in fast markets and smoother in slow markets.
Static: The sentiment line uses a fixed period, providing a consistent but less adaptive signal.
Table Usage:
The table helps you quickly compare recent sentiment shifts and see how the lookback period is changing (if dynamic is enabled).
Best Practices
Use the indicator on your preferred timeframe.
Enable dynamic lookback for more adaptive sentiment tracking, especially in volatile markets.
Use the sentiment difference to spot potential trend continuations or reversals:
Consistently positive values: Uptrend.
Consistently negative values: Downtrend.
Rapid flips: Possible trend changes or choppy market.
Combine with other indicators or price action for confirmation.
In Summary
This script gives you a dynamic perspective on market sentiment, adapting to volatility and providing clear, color-coded signals and data for each bar. It’s a useful tool for both trend-following and mean-reversion strategies.
Nota Keluaran
UPDATED July 25 2025 by ChalkBoardAnalytics. Added 2 user functions. 1.) Global Decimal Places with a default of 2. 2.) Chart Time Frame with default set at chart on screen but user can show other time frames if desired. This will allow user to have 2 or more of this indicator on the same chart at the same time showing different sentiment timeframe based values. This update also increased the number of data rows to 5 total now. This coincides with the NEW indicator Volume Up/Down with Table which is available under indicators in Trading View. Please leave any comments or suggestions and thank you for viewing.Skrip sumber terbuka
Dalam semangat TradingView sebenar, pencipta skrip ini telah menjadikannya sumber terbuka, jadi pedagang boleh menilai dan mengesahkan kefungsiannya. Terima kasih kepada penulis! Walaupuan anda boleh menggunakan secara percuma, ingat bahawa penerbitan semula kod ini tertakluk kepada Peraturan Dalaman.
Penafian
Maklumat dan penerbitan adalah tidak bertujuan, dan tidak membentuk, nasihat atau cadangan kewangan, pelaburan, dagangan atau jenis lain yang diberikan atau disahkan oleh TradingView. Baca lebih dalam Terma Penggunaan.
Skrip sumber terbuka
Dalam semangat TradingView sebenar, pencipta skrip ini telah menjadikannya sumber terbuka, jadi pedagang boleh menilai dan mengesahkan kefungsiannya. Terima kasih kepada penulis! Walaupuan anda boleh menggunakan secara percuma, ingat bahawa penerbitan semula kod ini tertakluk kepada Peraturan Dalaman.
Penafian
Maklumat dan penerbitan adalah tidak bertujuan, dan tidak membentuk, nasihat atau cadangan kewangan, pelaburan, dagangan atau jenis lain yang diberikan atau disahkan oleh TradingView. Baca lebih dalam Terma Penggunaan.