OPEN-SOURCE SCRIPT
RSI Divergence Fast by RSU
Advantages:
1. When rsi is at a high point, once it falls by 1 k line, it will detect the divergence from the previous high point. This can quickly find the divergence that has taken effect and help you quickly capture the trend before a sharp decline or rise.
The difference between other RSI divergence indicators: the official divergence indicator is to detect the 5 and the k line, which may lead to a large amount of decline.
2. This indicator detects the previous high and the previous low of 5, 10, 20 lengths at the same time, instead of only detecting a fixed length, so that more deviations can be found.
Notice:
Because it is a quick divergence detection, it is recommended to confirm that the divergence takes effect after the current k is completely closed first. I have identified this state in the indicator as "k not end"
Disadvantages and Risks
Since it is a quick discovery, there will be error identification. I listed the difference between the two indicators when deleting errors. The indicator turns off the "delete error" option by default.
Please do not:
Don't go short in the uptrend, don't go long in the downtrend.
Top divergences that occur because of a strong uptrend are usually only temporary pullbacks. Bottom divergences in persistent declines are also temporary rallies. Do not attempt to trade such low-return trades.
It is recommended to use the divergence indicator when the stock price has made a new high and retraced, and once again made a new high, because this often leads to the end of the trend.
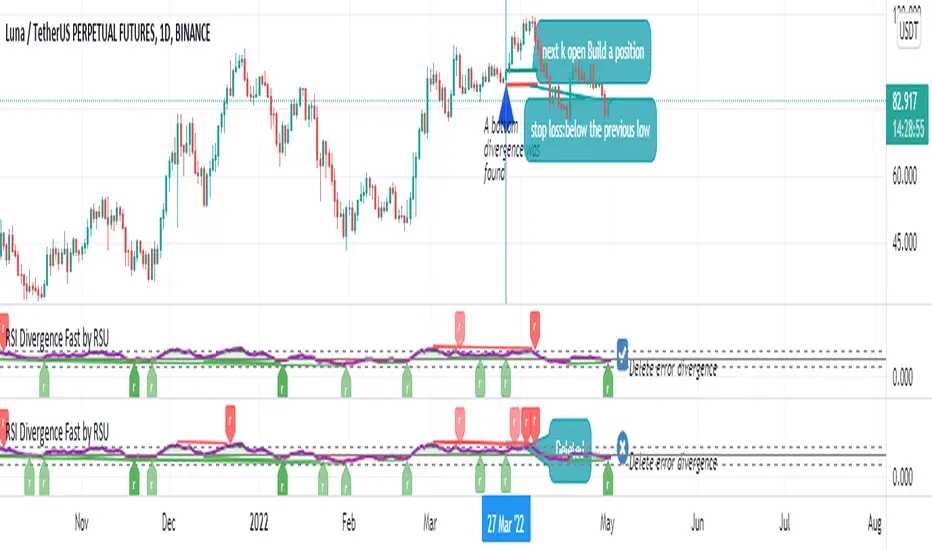
Divergence how to use:
1. After the previous K line was completely closed, a bottom divergence was found.
2. Open an long order at the beginning of the second bar, or as close to the bottom as possible (because the stop loss will be smaller).
3. Break the stop loss price below the previous low where the divergence occurred, which already means that the divergence is wrong.
RSI usage:
1. RSI is above the 50 line, in an uptrend, below 50 in a downtrend.
2. Above 70 is overbought, falling below the oversold zone may mean the end of the uptrend.
Below 30 is oversold, above the oversold zone may mean the end of the downtrend.
1. When rsi is at a high point, once it falls by 1 k line, it will detect the divergence from the previous high point. This can quickly find the divergence that has taken effect and help you quickly capture the trend before a sharp decline or rise.
The difference between other RSI divergence indicators: the official divergence indicator is to detect the 5 and the k line, which may lead to a large amount of decline.
2. This indicator detects the previous high and the previous low of 5, 10, 20 lengths at the same time, instead of only detecting a fixed length, so that more deviations can be found.
Notice:
Because it is a quick divergence detection, it is recommended to confirm that the divergence takes effect after the current k is completely closed first. I have identified this state in the indicator as "k not end"
Disadvantages and Risks
Since it is a quick discovery, there will be error identification. I listed the difference between the two indicators when deleting errors. The indicator turns off the "delete error" option by default.
Please do not:
Don't go short in the uptrend, don't go long in the downtrend.
Top divergences that occur because of a strong uptrend are usually only temporary pullbacks. Bottom divergences in persistent declines are also temporary rallies. Do not attempt to trade such low-return trades.
It is recommended to use the divergence indicator when the stock price has made a new high and retraced, and once again made a new high, because this often leads to the end of the trend.
Divergence how to use:
1. After the previous K line was completely closed, a bottom divergence was found.
2. Open an long order at the beginning of the second bar, or as close to the bottom as possible (because the stop loss will be smaller).
3. Break the stop loss price below the previous low where the divergence occurred, which already means that the divergence is wrong.
RSI usage:
1. RSI is above the 50 line, in an uptrend, below 50 in a downtrend.
2. Above 70 is overbought, falling below the oversold zone may mean the end of the uptrend.
Below 30 is oversold, above the oversold zone may mean the end of the downtrend.
Skrip sumber terbuka
Dalam semangat sebenar TradingView, pencipta skrip ini telah menjadikannya sumber terbuka supaya pedagang dapat menilai dan mengesahkan kefungsiannya. Terima kasih kepada penulis! Walaupun anda boleh menggunakannya secara percuma, ingat bahawa menerbitkan semula kod ini adalah tertakluk kepada Peraturan Dalaman kami.
Penafian
Maklumat dan penerbitan adalah tidak dimaksudkan untuk menjadi, dan tidak membentuk, nasihat untuk kewangan, pelaburan, perdagangan dan jenis-jenis lain atau cadangan yang dibekalkan atau disahkan oleh TradingView. Baca dengan lebih lanjut di Terma Penggunaan.