OPEN-SOURCE SCRIPT
Weekly Manipulation
Understanding the "Weekly Manipulation" Indicator
The "Weekly Manipulation" indicator is a powerful tool designed to identify false breakouts in the market—moments. Let me explain how it works in simple terms.
What This Indicator Detects
This indicator spots two specific market behaviors that often indicate manipulation:
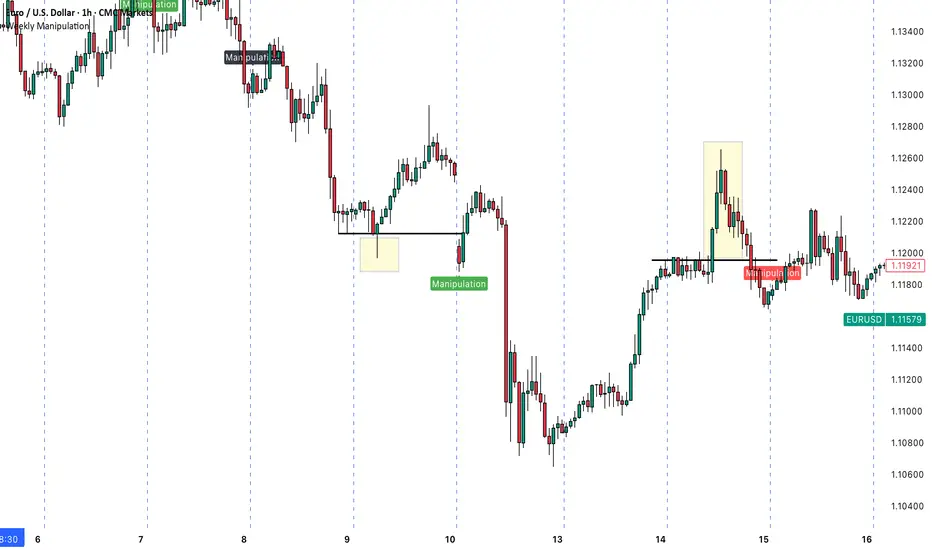
1. Single-Day Manipulation (Red/Green Labels)
This occurs when price briefly breaks through a significant daily level but fails to maintain the momentum:
Bearish Manipulation (Red): Price pushes above the previous day's high, but then reverses and closes below that high.
Bullish Manipulation (Green): Price drops below the previous day's low), but then reverses and closes above that low.
2. Two-Day Manipulation (Black Labels)
This is a more complex version of the same pattern, but occurring over a 2-day period. These signals can indicate even stronger manipulation attempts and potentially more powerful reversals.
Why This Matters for Your Trading
By identifying these patterns, you can:
- Avoid getting caught in false breakouts
- Find potential entry points after the manipulation is complete
- Understand when market action might not be genuine price discovery
How to Use This Indicator
1. Look for Red Markers: These appear when price has attempted to break higher but failed. This often suggests bearish potential going forward.
2. Look for Green Markers: These appear when price has attempted to break lower but failed. This often suggests bullish potential going forward.
3. Pay Attention to Black Markers: These 2-day patterns can signal stronger reversals and might be worth giving extra weight in your analysis.
The indicator labels these patterns clearly as "Manipulation" right on your chart, giving you an immediate visual cue when these potential setups occur.
The "Weekly Manipulation" indicator is a powerful tool designed to identify false breakouts in the market—moments. Let me explain how it works in simple terms.
What This Indicator Detects
This indicator spots two specific market behaviors that often indicate manipulation:
1. Single-Day Manipulation (Red/Green Labels)
This occurs when price briefly breaks through a significant daily level but fails to maintain the momentum:
Bearish Manipulation (Red): Price pushes above the previous day's high, but then reverses and closes below that high.
Bullish Manipulation (Green): Price drops below the previous day's low), but then reverses and closes above that low.
2. Two-Day Manipulation (Black Labels)
This is a more complex version of the same pattern, but occurring over a 2-day period. These signals can indicate even stronger manipulation attempts and potentially more powerful reversals.
Why This Matters for Your Trading
By identifying these patterns, you can:
- Avoid getting caught in false breakouts
- Find potential entry points after the manipulation is complete
- Understand when market action might not be genuine price discovery
How to Use This Indicator
1. Look for Red Markers: These appear when price has attempted to break higher but failed. This often suggests bearish potential going forward.
2. Look for Green Markers: These appear when price has attempted to break lower but failed. This often suggests bullish potential going forward.
3. Pay Attention to Black Markers: These 2-day patterns can signal stronger reversals and might be worth giving extra weight in your analysis.
The indicator labels these patterns clearly as "Manipulation" right on your chart, giving you an immediate visual cue when these potential setups occur.
Skrip sumber terbuka
In true TradingView spirit, the creator of this script has made it open-source, so that traders can review and verify its functionality. Kudos to the author! While you can use it for free, remember that republishing the code is subject to our House Rules.
Penafian
The information and publications are not meant to be, and do not constitute, financial, investment, trading, or other types of advice or recommendations supplied or endorsed by TradingView. Read more in the Terms of Use.