OPEN-SOURCE SCRIPT
Telah dikemas kini [NLR] - SweetSpot Zones
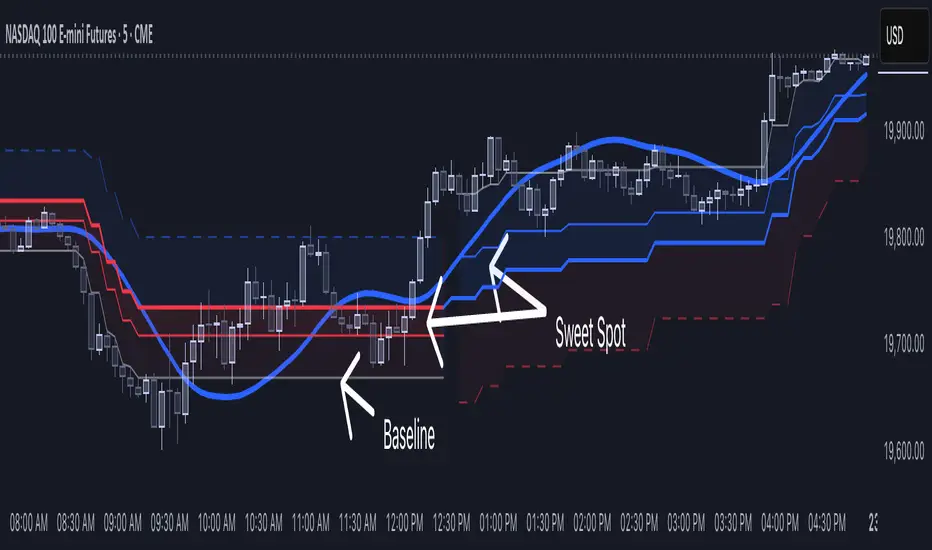
The Sweet Spot Zone helps you find the best spots to enter a trade, inspired by the "Follow Line Indicator" by Dreadblitz (big thanks to him!). It draws a colored zone on your chart to show ideal entry points, with a Base Point to keep you on track.
What It Does
How to Use It
Settings
Credits
Inspired by the "Follow Line Indicator" by Dreadblitz—check out his work for more great ideas!
What It Does
- Blue Zone: Uptrend—buy when the price dips into the zone.
- Red Zone: Downtrend—sell or short when the price climbs into the zone.
- Base Point: A gray line showing the key level the zone is built on.
How to Use It
- Look for the colored zone:
- Blue: Buy if the price dips into the zone but stays above the Base Point.
- Red: Sell/short if the price climbs into the zone but stays below the Base Point. - Important: Avoid entering trade beyond base point - you might see low returns and face big drawdowns.
- Confirm with other signals (like RSI/MACD) before entering.
Settings
- ATR Length (10): How far back it looks to calculate price movement.
- ATR Multiplier (2.5): How wide the zone is.
- Error Margin (5.0): Keeps the zone steady during small price wiggles.
- Uptrend/Downtrend Colors: Change the zone colors if you’d like!
Credits
Inspired by the "Follow Line Indicator" by Dreadblitz—check out his work for more great ideas!
Nota Keluaran
Added other side zone to show possible area where price action may goSkrip sumber terbuka
Dalam semangat TradingView sebenar, pencipta skrip ini telah menjadikannya sumber terbuka, jadi pedagang boleh menilai dan mengesahkan kefungsiannya. Terima kasih kepada penulis! Walaupuan anda boleh menggunakan secara percuma, ingat bahawa penerbitan semula kod ini tertakluk kepada Peraturan Dalaman.
Penafian
Maklumat dan penerbitan adalah tidak bertujuan, dan tidak membentuk, nasihat atau cadangan kewangan, pelaburan, dagangan atau jenis lain yang diberikan atau disahkan oleh TradingView. Baca lebih dalam Terma Penggunaan.
Skrip sumber terbuka
Dalam semangat TradingView sebenar, pencipta skrip ini telah menjadikannya sumber terbuka, jadi pedagang boleh menilai dan mengesahkan kefungsiannya. Terima kasih kepada penulis! Walaupuan anda boleh menggunakan secara percuma, ingat bahawa penerbitan semula kod ini tertakluk kepada Peraturan Dalaman.
Penafian
Maklumat dan penerbitan adalah tidak bertujuan, dan tidak membentuk, nasihat atau cadangan kewangan, pelaburan, dagangan atau jenis lain yang diberikan atau disahkan oleh TradingView. Baca lebih dalam Terma Penggunaan.