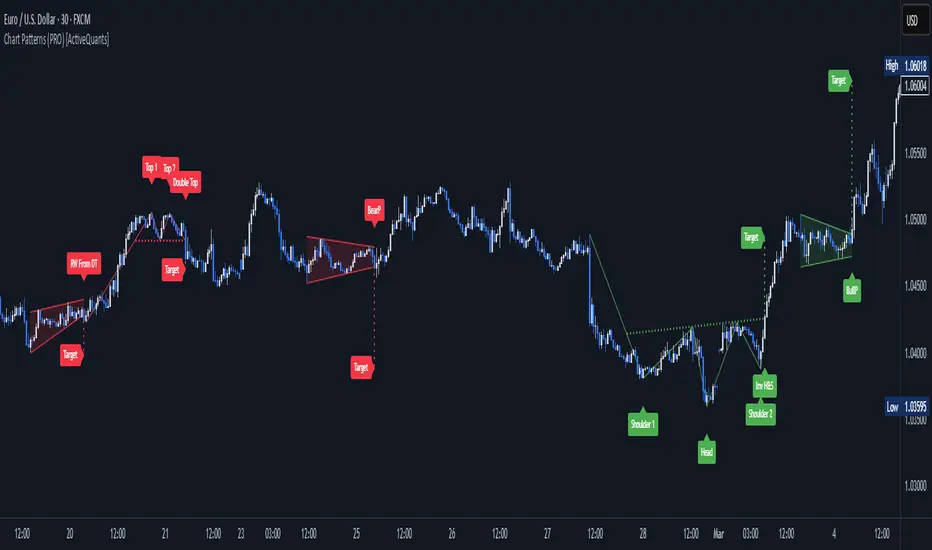
Chart Patterns (PRO) [ActiveQuants]
How It Works
The indicator employs a sophisticated multi-stage process:
- Precision Pivot Detection: At its heart, the indicator identifies significant swing highs and lows (pivot points) using an optimized internal period. These pivots are the fundamental building blocks for all pattern recognition. (Users can toggle visibility of these pivots).
- Advanced Pattern Recognition Engine: Sequences of these pivot points are meticulously analyzed against a vast library of predefined geometric conditions to identify chart patterns. This includes checks for relative pivot heights/lows, slope analysis of trendlines, and ATR-based proportionality for patterns like Head & Shoulders.
- Dynamic Status Tracking & Invalidation:
- Active: A pattern's initial structure is identified (e.g., two tops of a Double Top, or the converging trendlines of a Pennant). The pattern is developing.
- Confirmed: The pattern completes, and price breaks out/down from a key level (e.g., neckline, trendline) in the expected direction. Price targets are plotted upon confirmation.
- Invalidated: If price breaks out/down in the opposite direction of what's expected for an "Active" pattern, or if a new pivot forms that structurally compromises an "Active" Double Top/Bottom or Head & Shoulders before its confirmation, the pattern is marked "Invalid". - Price Target Projection: For confirmed patterns (excluding simple HH/LL structures), the indicator automatically calculates and plots potential price targets based on common technical analysis principles (e.g., pattern height projected from the breakout point).
█ DETECTED CHART PATTERNS
Chart Patterns (PRO) identifies a comprehensive list of 20 patterns, categorized for clarity:
I. Simple Market Structures:
- Lower Low (LL): Indicates bearish pressure, potentially forming part of a larger downtrend.
- Lower Low & Lower High (LL & LH): Stronger confirmation of a bearish trend.
- Higher High (HH): Signals bullish strength, potentially part of an uptrend.
- Higher High & Higher Low (HH & HL): Stronger confirmation of a bullish trend.
II. Reversal Patterns:
These patterns typically signal a potential end of the current trend and the beginning of a new one in the opposite direction.
- Double Top (DT): Bearish reversal. Two distinct peaks at similar levels.
- Double Bottom (DB): Bullish reversal. Two distinct troughs at similar levels.
- Head and Shoulders (H&S): Bearish reversal. A central peak (head) flanked by two smaller peaks (shoulders).
- Inverse Head and Shoulders (Inv H&S): Bullish reversal. A central trough (head) flanked by two smaller troughs (shoulders).
- Rising Wedge From Uptrend (RW From UT): Bearish reversal. Converging trendlines with an upward slant during an uptrend.
- Falling Wedge From Downtrend (FW From DT): Bullish reversal. Converging trendlines with a downward slant during a downtrend.
- Bearish Ascending Triangle (Reversal): Bearish reversal. A horizontal resistance line with rising support, typically occurring after a downtrend.
- Bullish Descending Triangle (Reversal): Bullish reversal. A horizontal support line with falling resistance, typically occurring after an uptrend.
III. Continuation Patterns:
These patterns typically suggest a temporary pause in the prevailing trend, after which the trend is likely to resume.
- Rising Wedge From Downtrend (RW From DT): Bearish continuation. An upward-slanted consolidation during a downtrend.
- Falling Wedge From Uptrend (FW From UT): Bullish continuation. A downward-slanted consolidation during an uptrend.
- Bearish Pennant: Bearish continuation. A small symmetrical triangle (converging trendlines) after a sharp downward move.
- Bullish Pennant: Bullish continuation. A small symmetrical triangle (converging trendlines) after a sharp upward move.
- Bearish Flag: Bearish continuation. A short, rectangular consolidation (parallel trendlines, often upward sloping) after a sharp downward move.
- Bullish Flag: Bullish continuation. A short, rectangular consolidation (parallel trendlines, often downward sloping) after a sharp upward move.
- Bearish Descending Triangle: Bearish continuation. Horizontal support and a descending resistance line during a downtrend.
- Bullish Ascending Triangle: Bullish continuation. Horizontal resistance and an ascending support line during an uptrend.
█ KEY FEATURES
- Automatic Price Target Projection:
- Once a pattern is "Confirmed," a price target is automatically plotted on the chart.
- Targets are calculated based on established technical methods, typically measuring the height of the pattern and projecting it from the breakout point.
- Includes a label displaying the target price level. Toggle with Show Price Targets.
- Advanced Multi-Status Alerts:
- Never miss an opportunity with highly configurable alerts.
- Receive notifications when a pattern is:
- Developing (Active): Get an early heads-up.
- Confirmed: Act on breakout signals.
- Invalidated: Re-assess your strategy quickly. - Alerts automatically include the pattern type and its status (e.g., "Double Top - Confirmed ✅").
- Additional contextual information included by default: Ticker Symbol, Chart Timeframe, Current Price, and Projected Target Price (for confirmed patterns).
- Enable/disable all alerts via the Enable Alerts setting.
- Comprehensive Pattern Validation & Invalidation:
- Patterns like Wedges, Triangles, Pennants, and Flags are monitored for breakouts. A breakout in the expected direction confirms the pattern; a breakout in the opposite direction invalidates it.
- Double Tops/Bottoms and Head & Shoulders have pre-confirmation invalidation logic: if a new pivot forms that compromises the pattern's structure before the neckline breaks, the pattern is marked "Invalid". This helps filter out weaker setups.
- ATR is used internally for proportional checks in patterns like Head & Shoulders, ensuring more reliable formations.
- Superior Visualizations:
- Pattern Fills: Wedges, Triangles, Pennants, and Flags are visually enhanced with a semi-transparent fill between their trendlines, making them easy to spot.
- Clear Necklines & Trendlines: Critical lines for patterns are drawn clearly.
- Distinct Labels: Each pattern receives a main label (e.g., "H&S", "BullP"). Double Tops/Bottoms and H&S also get individual component labels (Top 1/2, Shoulder 1/Head/Shoulder 2).
- Customizable Colors: Set distinct colors for bullish and bearish patterns.
- Pattern Display Control:
- Toggle visibility for each of the 20 individual pattern types.
- Filter displayed patterns by their status: All, Active, Confirmed, or Invalid.
- Control historical depth with Show Last History (Bars).
- Pivot Point Engine:
- The indicator uses an optimized internal lookback period for robust pivot detection.
- Optionally display these pivot high and low markers on your chart, with customizable colors.
█ USER INPUTS
Visibility and Common Styling
- Show Last History (Bars):
- Number of recent bars the indicator will analyze and plot patterns on.
- Default: 3000. Min: 10.
- Patterns (Visibility Filter):
- Filters displayed patterns based on their status.
- Options: All, Active, Confirmed, Invalid.
- Default: All.
- Show Price Targets:
- Toggles the display of calculated price targets for confirmed patterns.
- Default: Enabled.
- Bearish Color:
- Sets the color for bearish patterns and their components.
- Default: Red.
- Bullish Color:
- Sets the color for bullish patterns and their components.
- Default: Green.
Pivot Points
- Show Pivot Highs:
- Toggles the visibility of detected pivot high markers.
- Default: Enabled.
- Show Pivot Lows:
- Toggles the visibility of detected pivot low markers.
- Default: Enabled.
- Pivot Highs Color:
- Color for pivot high markers.
- Default: #ff5252 (Reddish).
- Pivot Lows Color:
- Color for pivot low markers.
- Default: #089981 (Greenish).
Pattern Toggles (Grouped by Type)
- Simple Structures:
- Lower Low (Default: Enabled)
- Lower Low & Lower High (Default: Enabled)
- Higher High (Default: Enabled)
- Higher High & Higher Low (Default: Enabled)
- Reversal Patterns:
- Double Tops (Default: Enabled)
- Double Bottoms (Default: Enabled)
- Head and Shoulders (Default: Enabled)
- Inverse Head and Shoulders (Default: Enabled)
- Rising Wedges From Uptrend (Default: Enabled)
- Falling Wedges From Downtrend (Default: Enabled)
- Bearish Ascending Triangles (Reversal context) (Default: Enabled)
- Bullish Descending Triangles (Reversal context) (Default: Enabled)
- Continuation Patterns:
- Rising Wedges From Downtrend (Default: Enabled)
- Falling Wedges From Uptrend (Default: Enabled)
- Bearish Pennants (Default: Enabled)
- Bullish Pennants (Default: Enabled)
- Bearish Flags (Default: Enabled)
- Bullish Flags (Default: Enabled)
- Bearish Descending Triangles (Continuation context) (Default: Enabled)
- Bullish Ascending Triangles (Continuation context) (Default: Enabled)
Alerts
- Enable Alerts:
- Master switch to enable or disable all alert notifications from this indicator.
- Default: Enabled. (Alert messages are pre-configured to include Pattern Type, Status, Symbol, Timeframe, Price, and Target Price when applicable and confirmed).
█ UNDERSTANDING PATTERN INVALIDATION
- Trendline Patterns (Wedges, Triangles, Pennants, Flags): An "Active" pattern is invalidated if price breaks its trendlines in the direction opposite to the expected breakout before a confirmation occurs. E.g., an Active Bullish Pennant is invalidated if price breaks below its lower trendline.
- Neckline Patterns (Double Tops/Bottoms, H&S): An "Active" pattern can be invalidated before a neckline break if a new pivot point forms that violates the pattern's structural integrity.
Example (Double Top): If Top 1, Neckline (P5), and Top 2 form (Active status), but before price breaks below P5, a new swing low forms at or above P5, the Double Top is invalidated. This indicates a failure to break support and potential renewed strength.
█ ALERTS GUIDE
- Add the "Chart Patterns (PRO)" indicator to your chart.
- Ensure Enable Alerts is checked in the indicator settings.
- In TradingView, click the "Alert" icon (clock) in the right toolbar or press ALT + A.
- In the "Create Alert" dialog:
- Condition: Select "Chart Patterns (PRO) [ActiveQuants]".
- For the condition dropdown below it, choose "Any alert() function call". This will trigger for any alert generated by the script.
- Interval: Choose whatever interval you want the alert to be triggered.
- Expiration: Choose the expiration date. - Customize your alert notification preferences (popup, email, webhook, etc.) and click "Create".
You will now receive alerts for pattern status changes (Developing, Confirmed, Invalidated) with detailed information.
█ CONCLUSION
The Chart Patterns (PRO) indicator is an indispensable tool for traders aiming to optimize their workflow. By automatically identifying and drawing classical chart patterns, it eliminates the need for manual chart analysis, thereby enabling users to dedicate substantially less time to chart monitoring. Its comprehensive detection, coupled with actionable insights like price targets and a meticulous status tracking system with alerts, provides a significant analytical edge. Automate your pattern recognition and drawing, and concentrate on making informed trading decisions with enhanced efficiency.
█ IMPORTANT NOTES
⚠ Confirmation is Crucial: While "Active" patterns provide early warnings, always await "Confirmed" status (e.g., neckline/trendline breaks) and consider volume and broader market context.
⚠ Non-Repainting Logic: Pattern detection and status updates are based on confirmed price bars and pivot points. Once a pattern is fully formed and its status set (Active, Confirmed, Invalid), it will not repaint its historical state. Initial drawing of "Active" patterns extends to the current bar and updates dynamically.
⚠ Combine with Other Tools: No indicator is a standalone solution. Use Chart Patterns (PRO) in conjunction with other forms of analysis (e.g., fundamental analysis, other indicators, volume analysis) and robust risk management.
⚠ Historical Data: Ensure sufficient historical data on your chart for patterns to form and be detected accurately. The Show Last History (Bars) setting can manage this.
⚠ Lagging Nature: By their very definition, chart patterns are lagging indicators as they require a sequence of price action and several pivot points to complete their formation.
█ RISK DISCLAIMER
Trading involves substantial risk of loss and is not suitable for all investors. The Chart Patterns (PRO) indicator and its generated information are for educational and informational purposes only. It does not constitute financial advice or a recommendation to buy or sell any security. Chart patterns and projected targets indicate potential price movements based on historical tendencies but do not guarantee future results. Always conduct your own due diligence, consider multiple factors, and consult with a qualified financial advisor before making investment decisions. Past performance is not indicative of future results.
📈 Happy trading! 🚀
Skrip jemputan sahaja
Hanya pengguna disahkan oleh penulis boleh mengakses skrip ini. Anda perlu memohon dan mendapatkan kebenaran untuk menggunakannya. Keizinan selalunya diberikan selepas pembayaran. Untuk lebih butiran, ikuti arahan penulis di bawah atau hubungi ActiveQuants secara terus.
TradingView TIDAK menyarankan pembayaran atau penggunaan skrip kecuali anda mempercayai sepenuhnya penulis dan memahami bagaimana ia berfungsi. Anda juga boleh menjumpai alternatif sumber terbuka dan percuma yang lain di dalam skrip komuniti kami.
Arahan penulis
Penafian
Skrip jemputan sahaja
Hanya pengguna disahkan oleh penulis boleh mengakses skrip ini. Anda perlu memohon dan mendapatkan kebenaran untuk menggunakannya. Keizinan selalunya diberikan selepas pembayaran. Untuk lebih butiran, ikuti arahan penulis di bawah atau hubungi ActiveQuants secara terus.
TradingView TIDAK menyarankan pembayaran atau penggunaan skrip kecuali anda mempercayai sepenuhnya penulis dan memahami bagaimana ia berfungsi. Anda juga boleh menjumpai alternatif sumber terbuka dan percuma yang lain di dalam skrip komuniti kami.