PROTECTED SOURCE SCRIPT
NK-Macd + Rsi3
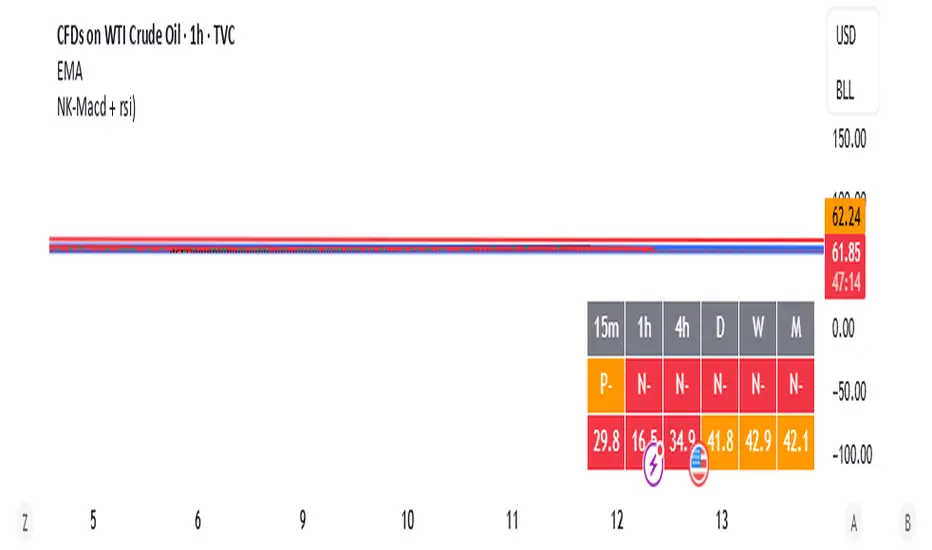
Here in one table you can see the MACD of the different time frame that what is the status of the MACD, is it above zero line or below zero line.
Second you will see in table that RSI number of all time frame, so here we dont need to go and check RSI by switching the chart and time frame.
at one place you will see both RSI and MACD, and by seeing the number you can check when the price in oversold zone and when it will in overbought also you can see the when the price in momentum and when not.
Example :- let assume RSI table showing above 40 in 1 hr and 67 in daily that means RSI is in swing momentum in hrly but momentum in daily.
Skrip dilindungi
Skrip ini diterbitkan sebagai sumber tertutup. Akan tetapi, anda boleh menggunakannya secara bebas dan tanpa apa-apa had – ketahui lebih di sini.
Penafian
Maklumat dan penerbitan adalah tidak bertujuan, dan tidak membentuk, nasihat atau cadangan kewangan, pelaburan, dagangan atau jenis lain yang diberikan atau disahkan oleh TradingView. Baca lebih dalam Terma Penggunaan.