OPEN-SOURCE SCRIPT
Telah dikemas kini FTD & DD Analyzer
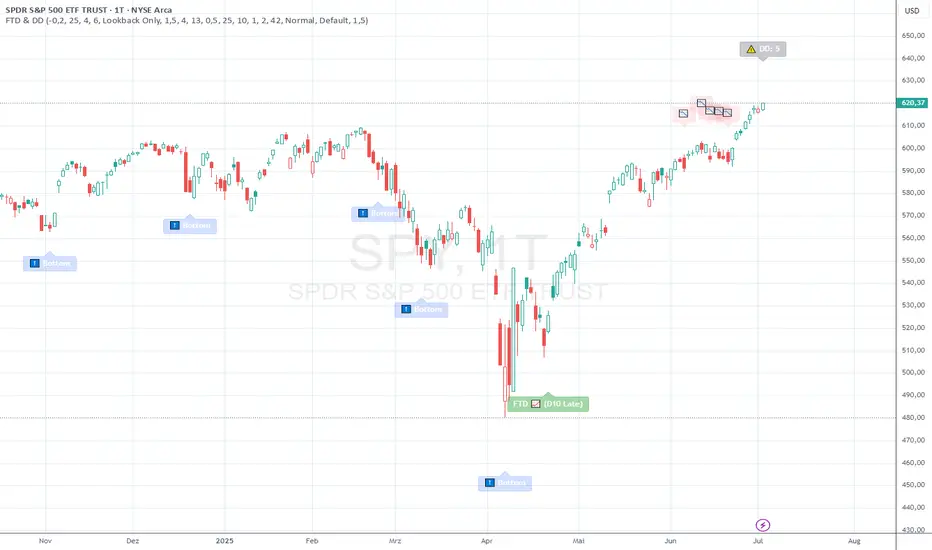
FTD & DD Analyzer
A comprehensive tool for identifying Follow-Through Days (FTDs) and Distribution Days (DDs) to analyze market conditions and potential trend changes, based on William J. O'Neil's proven methodology.
About the Methodology
This indicator implements the market analysis techniques developed by William J. O'Neil, founder of Investor's Business Daily and author of "How to Make Money in Stocks." O'Neil's research, spanning market data back to the 1880s, has successfully identified major market turns throughout history. His FTD and DD concepts remain crucial tools for institutional investors and serious traders.
Overview
This indicator helps traders identify two critical market conditions:
The combination of these signals provides valuable insight into market health and potential trend changes.
Key Features
Distribution Days Analysis
What is a Distribution Day?
A Distribution Day occurs when:
DD Settings
Follow-Through Day Detection
What is a Follow-Through Day?
Following O'Neil's research, a Follow-Through Day confirms a potential market bottom when:
Key Statistics:
FTD Settings
Market Bottom Detection
The indicator uses a sophisticated approach to identify potential market bottoms:
EMA Analysis:
Price Action:
Visual Indicators
Label Types
Customization Options
Practical Usage
1. Monitor DD Accumulation:
2. Bottom Recognition:
3. FTD Confirmation:
Alert System
Built-in alerts for:
Tips for Best Results
Technical Notes
Additional Information
Conclusion
The FTD & DD Analyzer provides a systematic approach to market analysis, combining O'Neil's proven methodologies with modern technical analysis. It helps traders identify potential market turns while monitoring institutional participation through volume analysis.
Remember that no indicator is perfect - always use in conjunction with other analysis tools and proper risk management.
A comprehensive tool for identifying Follow-Through Days (FTDs) and Distribution Days (DDs) to analyze market conditions and potential trend changes, based on William J. O'Neil's proven methodology.
About the Methodology
This indicator implements the market analysis techniques developed by William J. O'Neil, founder of Investor's Business Daily and author of "How to Make Money in Stocks." O'Neil's research, spanning market data back to the 1880s, has successfully identified major market turns throughout history. His FTD and DD concepts remain crucial tools for institutional investors and serious traders.
Overview
This indicator helps traders identify two critical market conditions:
- Distribution Days (DDs) - days of institutional selling pressure
- Follow-Through Days (FTDs) - confirmation of potential market bottoms and new uptrends
The combination of these signals provides valuable insight into market health and potential trend changes.
Key Features
- Distribution Day detection with customizable criteria
- Follow-Through Day identification based on classical methodology
- Market bottom detection using EMA analysis
- Dynamic warning system for accumulated Distribution Days
- Visual alerts with customizable labels
- Advanced debug mode for detailed analysis
- Flexible display options for different trading styles
Distribution Days Analysis
What is a Distribution Day?
A Distribution Day occurs when:
- The price closes lower by a specified percentage (default -0.2%)
- Volume is higher than the previous day
DD Settings
- Price Threshold: Minimum price decline to qualify (default -0.2%)
- Lookback Period: Number of days to analyze for DD accumulation (default 25)
- Warning Levels:
- First warning at 4 DDs
- Severe warning (SOS - Sign of Strength) at 6 DDs
- Display Options:
- Show/hide DD count
- Show/hide DD labels
- Choose between showing all DDs or only within lookback period
Follow-Through Day Detection
What is a Follow-Through Day?
Following O'Neil's research, a Follow-Through Day confirms a potential market bottom when:
- Occurs between day 4 and 13 after a bottom formation (optimal: days 4-7)
- Shows significant price gain (default 1.5%)
- Accompanied by higher volume than the previous day
Key Statistics:
- FTDs followed by distribution on days 1-2 fail 95% of the time
- Distribution on day 3 leads to 70% failure rate
- Later distribution (days 4-5) shows only 30% failure rate
FTD Settings
- Minimum Price Gain: Required percentage gain (default 1.5%)
- Valid Window: Day 4 to Day 13 after bottom
- Quality Rating:
- 🚀 for FTDs occurring within 7 days (historically most reliable)
- ⭐ for later FTDs
Market Bottom Detection
The indicator uses a sophisticated approach to identify potential market bottoms:
EMA Analysis:
- Tracks 8 and 21-period EMAs
- Monitors EMA alignment and momentum
- Customizable tolerance levels
Price Action:
- Looks for lower lows within specified lookback period
- Confirms bottom with subsequent price action
- Reset mechanism to prevent false signals
Visual Indicators
Label Types
- 📉 Distribution Days
- ⬇️ Market Bottoms
- 🚀/⭐ Follow-Through Days
- ⚠️ DD Warning Levels
Customization Options
- Label size: Tiny, Small, Normal, Large
- Label style: Default, Arrows, Triangles
- Background colors for different signals
- Dynamic positioning using ATR multiplier
Practical Usage
1. Monitor DD Accumulation:
- Watch for increasing number of Distribution Days
- Pay attention to warning levels (4 and 6 DDs)
- Consider reducing exposure when warnings appear
2. Bottom Recognition:
- Look for potential bottom formations
- Monitor EMA alignment and price action
- Wait for confirmation signals
3. FTD Confirmation:
- Track days after potential bottom
- Watch for strong price/volume action in valid window
- Note FTD quality rating for additional context
Alert System
Built-in alerts for:
- New Distribution Days
- Follow-Through Day signals
- High DD accumulation warnings
Tips for Best Results
- Use multiple timeframes for confirmation
- Combine with other market health indicators
- Pay attention to sector rotation and market leadership
- Monitor volume patterns for confirmation
- Consider market context and external factors
Technical Notes
- The indicator uses advanced array handling for DD tracking
- Dynamic calculations ensure accurate signal generation
- Debug mode available for detailed analysis
- Optimized for real-time and historical analysis
Additional Information
- Compatible with all markets and timeframes
- Best suited for daily charts
- Regular updates and maintenance
- Based on O'Neil's time-tested market analysis principles
Conclusion
The FTD & DD Analyzer provides a systematic approach to market analysis, combining O'Neil's proven methodologies with modern technical analysis. It helps traders identify potential market turns while monitoring institutional participation through volume analysis.
Remember that no indicator is perfect - always use in conjunction with other analysis tools and proper risk management.
Nota Keluaran
Update - Enhanced Bottom Detection & Bug Fixes🔧 Major Bug Fixes:
- Fixed critical FTD day counting error - now shows correct days since bottom
- Resolved state machine blocking issue that prevented detection of new bottoms
- Fixed FTD labels appearing multiple times - now triggers only once per valid signal
⚡ Enhanced Bottom Detection:
- Improved detection for extreme market conditions (tested on Corona crash March 2020)
- Immediate bottom reset when price breaks below previous low by 3%
- Simplified detection logic for more reliable signals
🎨 Visual Improvements:
- Optimized label transparency for better readability
- Enhanced FTD quality indicators: 🚀 Strong (D4-6), ⭐ Good (D7-9), 📈 Late (D10-13)
- Bottom labels now appear at actual low price level when confirmed
📊 Technical Enhancements:
- More accurate trading day calculation using bar_index differential
- Streamlined state machine for better performance
- Enhanced reset mechanisms for continuous bottom detection
This update significantly improves the accuracy of Follow-Through Day detection and bottom identification, also during extreme market conditions. The indicator now properly tracks major market bottoms like the March 2020 Corona crash.
Skrip sumber terbuka
Dalam semangat TradingView sebenar, pencipta skrip ini telah menjadikannya sumber terbuka, jadi pedagang boleh menilai dan mengesahkan kefungsiannya. Terima kasih kepada penulis! Walaupuan anda boleh menggunakan secara percuma, ingat bahawa penerbitan semula kod ini tertakluk kepada Peraturan Dalaman.
Professional Indicator Development | CFTe Certified
20+ years software development experience. Certified technical analyst (CFTe) creating high-quality PineScript indicators based on proven TA methods.
☕ Support: buymeacoffee.com/joericke
20+ years software development experience. Certified technical analyst (CFTe) creating high-quality PineScript indicators based on proven TA methods.
☕ Support: buymeacoffee.com/joericke
Penafian
Maklumat dan penerbitan adalah tidak bertujuan, dan tidak membentuk, nasihat atau cadangan kewangan, pelaburan, dagangan atau jenis lain yang diberikan atau disahkan oleh TradingView. Baca lebih dalam Terma Penggunaan.