OPEN-SOURCE SCRIPT
Hancock - WAE
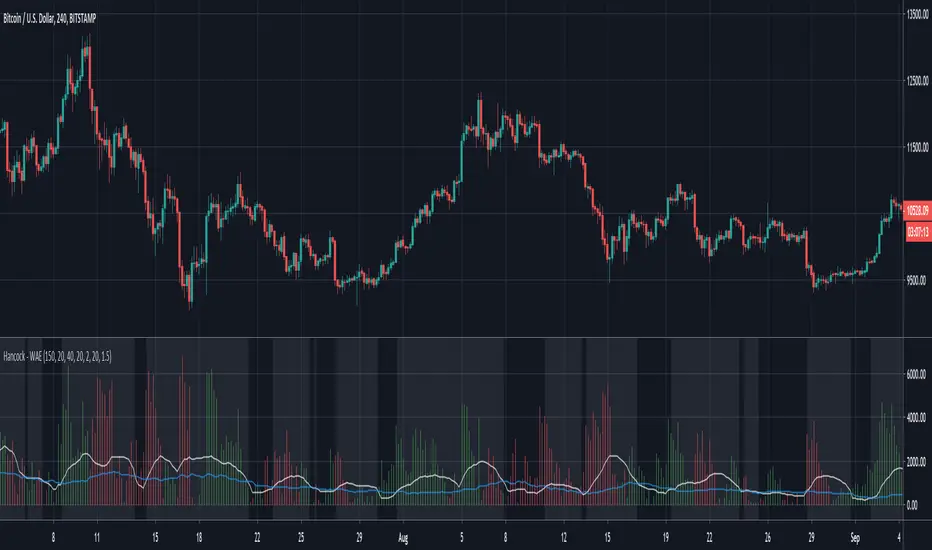
This is a version of the LazyBear Waddah Attar Explosion indicator that incorporates the LazyBear Squeeze Momentum Indicator. Full credit goes to LazyBear for this and i've added links to his indicators used for a further explanation.
This histogram is a plot of the difference between the current and previous MACD multiplier by the sensitivity value. Green indicates an up trend and red indicates a down trend.
The white line is the lower BB subtracted from the upper BB and signals should be taken when the histogram is greater than this line.
The blue line is taken from the Squeeze Indicator and is the Keltner Channel. If the white line is less than the blue line it can be considered a squeeze and the background color of the indicator is coloured to indicate when not in a squeeze.
Happy trading folks!
Hancock
Skrip sumber terbuka
Dalam semangat sebenar TradingView, pencipta skrip ini telah menjadikannya sumber terbuka supaya pedagang dapat menilai dan mengesahkan kefungsiannya. Terima kasih kepada penulis! Walaupun anda boleh menggunakannya secara percuma, ingat bahawa menerbitkan semula kod ini adalah tertakluk kepada Peraturan Dalaman kami.
Penafian
Maklumat dan penerbitan adalah tidak dimaksudkan untuk menjadi, dan tidak membentuk, nasihat untuk kewangan, pelaburan, perdagangan dan jenis-jenis lain atau cadangan yang dibekalkan atau disahkan oleh TradingView. Baca dengan lebih lanjut di Terma Penggunaan.