MTF Market Structure Pivots/Dealing Ranges | InvrsROBINHOOD
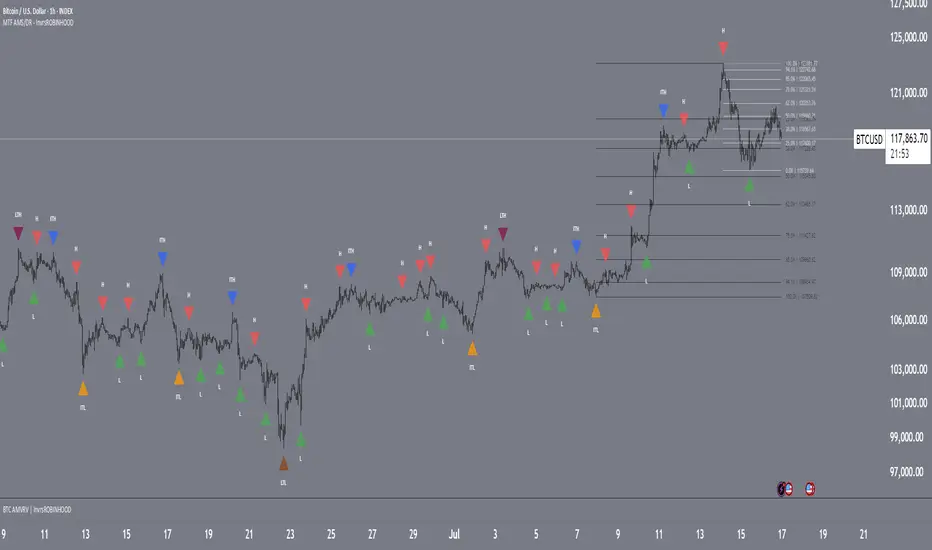
This indicator provides a sophisticated framework for analyzing market structure by identifying and classifying key pivot points on the user defined higher timeframes. It automatically draws the most relevant bullish and bearish dealing ranges based on this structure, equipping traders with a clear and objective view of the market's flow and potential areas of interest whilst on the lower timeframes.
Understanding Market Structure
At its core, market structure is the sequence of highs and lows that form the trend. This indicator demystifies market structure by categorizing pivots into a three-tiered hierarchy, allowing you to instantly gauge the significance of a swing point.
The Hierarchy of Pivots
Short Term Highs (H) & Lows (L)
These are the most basic swing points in price action, representing minor, localized turning points. They are the fundamental building blocks of all larger trends and structures. While common, they help define the immediate price action and short-term directional bias.
Intermediate Highs (ITH) & Lows (ITL)
An Intermediate High (ITH) is a short-term high that is higher than the short-term highs immediately preceding and succeeding it. Similarly, an Intermediate Low (ITL) is a short-term low that is lower than its neighboring lows.
Importance: These pivots are significantly more important than standard H/L points. They represent a more substantial shift in supply and demand and often mark the beginning or end of a corrective wave within a larger trend. A break of an ITH or ITL suggests a potential change in the intermediate-term trend.
Long Term Highs (LTH) & Lows (LTL)
These are the most critical pivots identified by the indicator. A Long Term High (LTH) is an intermediate high that is higher than the intermediate highs on either side of it. A Long Term Low (LTL) is an intermediate low that is lower than its neighboring intermediate lows.
Importance: LTH and LTL points represent major structural anchors. They often define the boundaries of long-term trading ranges, mark the conclusion of major market cycles, or signal a significant trend reversal. A price break beyond an LTH or LTL is a powerful confirmation that the long-term market structure has shifted.
By understanding this hierarchy, a trader can better assess the strength of a trend. For example, in a strong uptrend, price will consistently form higher L's, IPL's, and LTL's. A break of a key ITL would be the first major warning sign that the dominant bullish structure is in jeopardy.
The Dealing Range: Fibonacci Analysis
Beyond identifying pivots, the indicator's primary function is to establish the current Dealing Range. A dealing range is the price zone between a significant structural pivot and the subsequent impulse move away from it. The indicator uses a proprietary scoring system to objectively identify the most probable and "protected" high or low to anchor these ranges.
How to Use the Dealing Ranges
The indicator will plot two potential dealing ranges, one bullish and one bearish, complete with key Fibonacci retracement levels.
Bullish Dealing Range (Black):
This range is drawn from a significant low (the anchor) up to the highest high formed after that low.
Application: This range highlights potential "discount" buying opportunities. When price pulls back from the high, the Fibonacci levels (e.g., 50%, 61.8%, 78.6%) serve as high-probability zones where buyers may step in to resume the upward trend. The original low of the range is the ultimate invalidation point for this bullish idea.
Invalidation: The bullish range is considered complete and will be removed if the price breaks above the high of the range, as the market has shown its intention to continue higher. The indicator will then seek to establish a new range.
Bearish Dealing Range (White):
This range is drawn from a significant high (the anchor) down to the lowest low formed after that high.
Application: This range identifies potential "premium" selling opportunities. As price rallies from the low, the Fibonacci levels act as potential resistance zones where sellers may re-emerge to continue the downward trend. The original high of the range is the ultimate invalidation for this bearish scenario.
Invalidation: The bearish range is considered complete and will be removed if the price breaks below the low of the range, signaling a continuation of the downtrend. The indicator will then await a new structure to form.
By combining a hierarchical understanding of market structure with automatically drawn Fibonacci dealing ranges, this tool helps traders to objectively identify the trend, frame high-probability trade ideas, and manage risk with clearly defined levels of interest and invalidation.
• Fixed label placement for DR's
Skrip jemputan sahaja
Hanya pengguna disahkan oleh penulis boleh mengakses skrip ini. Anda perlu memohon dan mendapatkan kebenaran untuk menggunakannya. Keizinan selalunya diberikan selepas pembayaran. Untuk lebih butiran, ikuti arahan penulis di bawah atau hubungi InvrsROBINHOOD secara terus.
TradingView TIDAK menyarankan pembayaran atau penggunaan skrip kecuali anda mempercayai sepenuhnya penulis dan memahami bagaimana ia berfungsi. Anda juga boleh menjumpai alternatif sumber terbuka dan percuma yang lain di dalam skrip komuniti kami.
Arahan penulis
Penafian
Skrip jemputan sahaja
Hanya pengguna disahkan oleh penulis boleh mengakses skrip ini. Anda perlu memohon dan mendapatkan kebenaran untuk menggunakannya. Keizinan selalunya diberikan selepas pembayaran. Untuk lebih butiran, ikuti arahan penulis di bawah atau hubungi InvrsROBINHOOD secara terus.
TradingView TIDAK menyarankan pembayaran atau penggunaan skrip kecuali anda mempercayai sepenuhnya penulis dan memahami bagaimana ia berfungsi. Anda juga boleh menjumpai alternatif sumber terbuka dan percuma yang lain di dalam skrip komuniti kami.