PROTECTED SOURCE SCRIPT
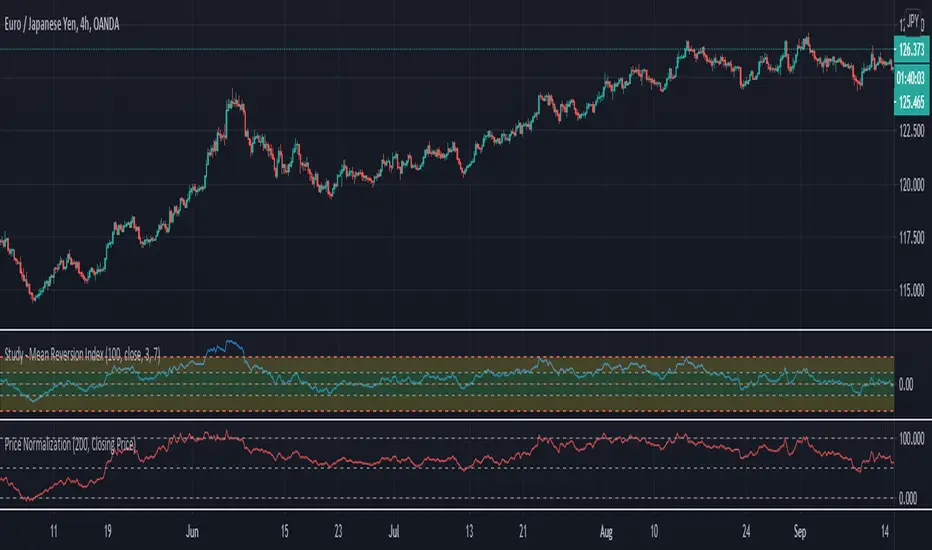
Closing Price Normalization

Indicator title : Price Normalized
Description : The indicator is a variation of %k Stochastic where it use highest/lowest closing price to define the range instead of highest high/lowest low,
the range also excluded current bar so that break above 100 or below 0 means current bar closing price breaks above highest/below lowest the closing price in the past 200 bars (default setting)
Simplest way to interpret the indicator is that as price retraced downward while indicator still above 50 value, it means the closing price still traded on the upper side of last 200 bars range
Warning: While the indicator assume similar characteristic as Stochastic Indicator, its is not meant to be used to determnine ovebought/oversold zone.
Disclaimer:
I always felt Pinescript is a very fast to type language with excellent visualization capabilities, so I've been using it as code-testing platform prior to actual coding in other platform.
Having said that, these study scripts was built only to test/visualize an idea to see its viability and if it can be used to optimize existing strategy.
While some of it are useful and most are useless, none of it should be use as main decision maker.
© fareidzulkifli
Skrip dilindungi
Skrip ini diterbitkan sebagai sumber tertutup. Akan tetapi, anda boleh menggunakannya secara bebas dan tanpa apa-apa had – ketahui lebih di sini.
Penafian
Maklumat dan penerbitan adalah tidak bertujuan, dan tidak membentuk, nasihat atau cadangan kewangan, pelaburan, dagangan atau jenis lain yang diberikan atau disahkan oleh TradingView. Baca lebih dalam Terma Penggunaan.