PROTECTED SOURCE SCRIPT
Ultimate Gann Fan Suite with Multi-Arcs
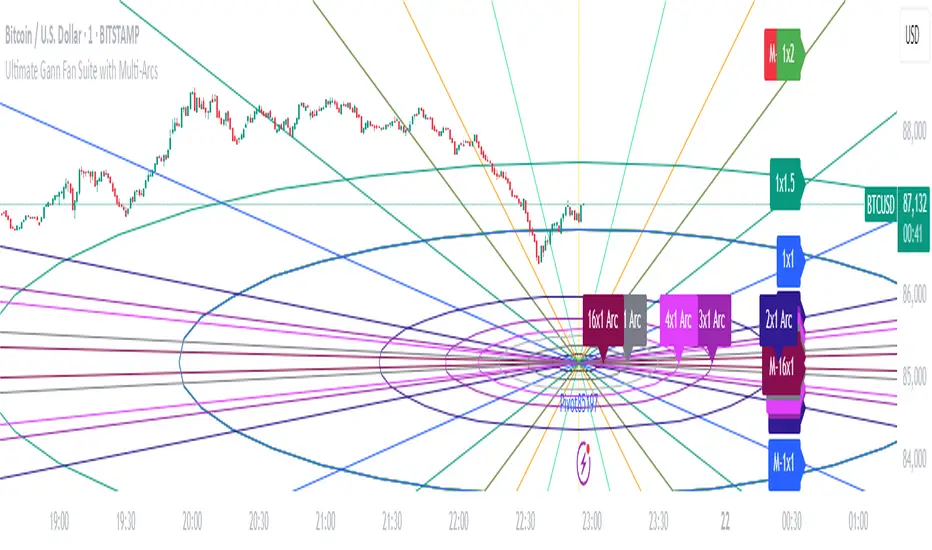
Ultimate Gann Fan Suite with Multi-Arcs
This open-source indicator plots Gann Fan angles, arcs, and levels to analyze price and time relationships based on a user-selected pivot point.
What It Does:
- Draws Gann Fan angles (1x16 to 16x1) from a pivot, with optional mirrored lines.
- Plots a base Gann arc and multi-arcs scaled by Gann ratios.
- Displays a Square of 9 grid and Gann Square levels for price projections.
- Supports custom timeframes and price types for pivot selection.
How to Use:
- Pivot: Enable manual pivot picking and select a price type (e.g., Close, High).
- Timeframe: Choose a timeframe (e.g., Daily) for pivot data.
- Angles and Arcs: Show/hide specific Gann angles, arcs, or levels; adjust colors and line styles.
- Scaling: Set price scale (e.g., 9.0) and arc radius (e.g., 36) for visual clarity.
- Labels: Enable labels to identify angles and levels.
- Best for stocks, forex, or crypto on daily or weekly charts.
Notes:
- Ensure enough chart history for the selected timeframe.
- Use on assets with clear trends or cycles for best results.
- Adjust settings to balance chart readability.
Skrip dilindungi
Skrip ini diterbitkan sebagai sumber tertutup. Akan tetapi, anda boleh menggunakannya secara bebas dan tanpa apa-apa had – ketahui lebih di sini.
Penafian
Maklumat dan penerbitan adalah tidak bertujuan, dan tidak membentuk, nasihat atau cadangan kewangan, pelaburan, dagangan atau jenis lain yang diberikan atau disahkan oleh TradingView. Baca lebih dalam Terma Penggunaan.