OPEN-SOURCE SCRIPT
Telah dikemas kini [blackcat] L1 Jon Andersen Standard Error Bands
Level: 1
Background
The standard error bands created by Jon Andersen in "Standard error bands" in the September 1996 STOCKS & COMMODITIES.
Function
This script calculates the beta and alpha coefficients of the linear regression. First, it creates the calcB and calcA functions, which refer to the beta and alpha coefficients. Create calcB first, then calcA. These functions are used in calculating the regression coefficients for the standard error bands. In This standard error bands indicator, the "Length" value specifies the period of the linear regression line; the default is 21. The SDeg value specifies the smoothing factor that is used to smooth the linear regression and standard error bands; the default is 3.
Key Signal
LinRegS --> standard error bands center line
LinRegS + SErr --> standard error bands upper line
LinRegS - SErr --> standard error bands lower line
Labels and alerts are added.
Remarks
Feedbacks are appreciated.
Readme
In real life, I am a prolific inventor. I have successfully applied for more than 60 international and regional patents in the past 12 years. But in the past two years or so, I have tried to transfer my creativity to the development of trading strategies. Tradingview is the ideal platform for me. I am selecting and contributing some of the hundreds of scripts to publish in Tradingview community. Welcome everyone to interact with me to discuss these interesting pine scripts.
The scripts posted are categorized into 5 levels according to my efforts or manhours put into these works.
Level 1 : interesting script snippets or distinctive improvement from classic indicators or strategy. Level 1 scripts can usually appear in more complex indicators as a function module or element.
Level 2 : composite indicator/strategy. By selecting or combining several independent or dependent functions or sub indicators in proper way, the composite script exhibits a resonance phenomenon which can filter out noise or fake trading signal to enhance trading confidence level.
Level 3 : comprehensive indicator/strategy. They are simple trading systems based on my strategies. They are commonly containing several or all of entry signal, close signal, stop loss, take profit, re-entry, risk management, and position sizing techniques. Even some interesting fundamental and mass psychological aspects are incorporated.
Level 4 : script snippets or functions that do not disclose source code. Interesting element that can reveal market laws and work as raw material for indicators and strategies. If you find Level 1~2 scripts are helpful, Level 4 is a private version that took me far more efforts to develop.
Level 5 : indicator/strategy that do not disclose source code. private version of Level 3 script with my accumulated script processing skills or a large number of custom functions. I had a private function library built in past two years. Level 5 scripts use many of them to achieve private trading strategy.
Nota Keluaran
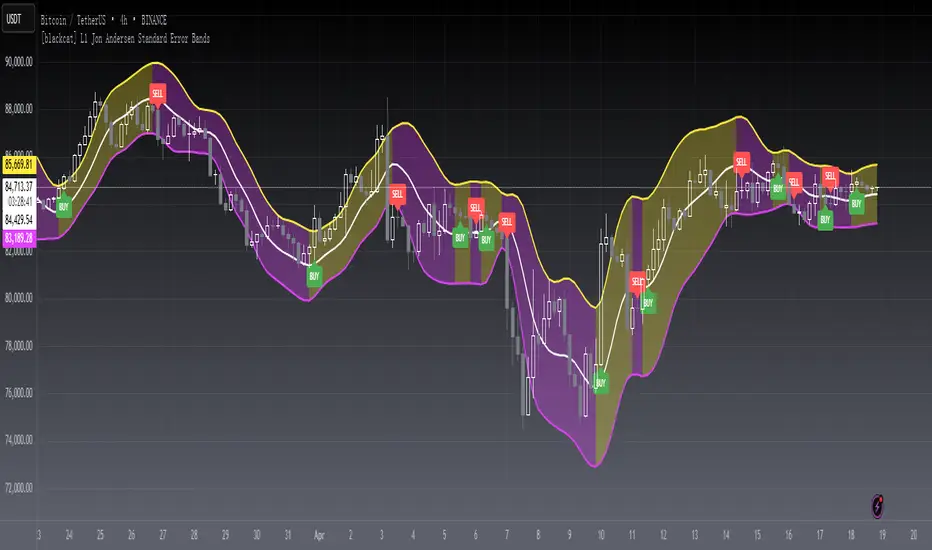
OVERVIEWThe [blackcat] L1 Jon Andersen Standard Error Bands script is a powerful tool designed for technical analysis in TradingView. It calculates and plots linear regression and standard error bands, providing traders with valuable insights into market trends and potential trading opportunities. The script includes customizable input parameters for price source, smoothing length, and standard deviation length, allowing users to tailor the analysis to their specific needs. Additionally, it generates buy and sell signals based on the linear regression values, helping traders make informed decisions.
FEATURES
Customizable input parameters for price source, smoothing length, and standard deviation length.
Calculation and plotting of linear regression and standard error bands.
Generation of buy and sell signals based on linear regression values.
Visual indicators for buy and sell signals.
Alerts for buy and sell signals.
HOW TO USE
Add the Script to Your Chart:
Open TradingView and go to the chart where you want to apply the script.
Click on the "Pine Editor" tab at the bottom of the screen.
Copy and paste the script code into the Pine Editor.
Click "Add to Chart" to apply the script to your chart.
Customize Input Parameters:
Adjust the input parameters as needed:
Price Source: Select the price source (e.g., hl2, close, etc.).
Smoothing Length: Set the length for smoothing the linear regression.
Standard Deviation Length: Set the length for calculating the standard error.
Interpret the Results:
Observe the plotted linear regression and standard error bands on your chart.
Look for buy and sell signals indicated by the script.
Use the generated alerts to receive notifications for potential trading opportunities.
LIMITATIONS
The script relies on historical data and may not always predict future market movements accurately.
Customization of input parameters is essential for optimal performance.
The script is designed for technical analysis and should be used in conjunction with other analysis tools and strategies.
NOTES
Ensure that your TradingView account has access to the necessary historical data for accurate calculations.
Regularly review and update the input parameters to adapt to changing market conditions.
Skrip sumber terbuka
Dalam semangat TradingView sebenar, pencipta skrip ini telah menjadikannya sumber terbuka, jadi pedagang boleh menilai dan mengesahkan kefungsiannya. Terima kasih kepada penulis! Walaupuan anda boleh menggunakan secara percuma, ingat bahawa penerbitan semula kod ini tertakluk kepada Peraturan Dalaman.
Avoid losing contact!Don't miss out! The first and most important thing to do is to join my Discord chat now! Click here to start your adventure: discord.com/invite/ZTGpQJq 防止失联,请立即行动,加入本猫聊天群: discord.com/invite/ZTGpQJq
Penafian
Maklumat dan penerbitan adalah tidak bertujuan, dan tidak membentuk, nasihat atau cadangan kewangan, pelaburan, dagangan atau jenis lain yang diberikan atau disahkan oleh TradingView. Baca lebih dalam Terma Penggunaan.