OPEN-SOURCE SCRIPT
Telah dikemas kini Fixed Range Levels
This indicator draws horizontal price levels on your chart based on a starting price and a range size that you define. It can also draw midpoint lines between the main levels if enabled.
Here's a breakdown of its functionality:
Key Features:
Starting Price:
You define a starting price (e.g., 21630).
The indicator calculates a corrected base price by rounding the starting price to the nearest multiple of the range size.
Range Size:
You define a range size (e.g., 71).
The indicator draws horizontal lines at intervals of the range size above and below the corrected base price.
Dual Ranges:
You can define two range sizes (e.g., 71 and 29).
The indicator can draw levels for both ranges simultaneously or individually, depending on your settings.
Midpoint Lines:
If enabled, the indicator draws midpoint lines between the main levels.
For example, if the main levels are at 21584 and 21655, the midpoint line will be at 21619.5.
Customizable Styles:
You can customize the line style (solid, dotted, dashed) and color for both the main levels and midpoint lines.
Dynamic Levels:
The levels are recalculated and redrawn dynamically based on the starting price and range size.
How It Works:
Corrected Base Price Calculation:
The indicator calculates the corrected base price using the formula:
pinescript
Copy
correctedBasePrice = math.floor(startingPrice / rangeSize) * rangeSize
For example, if startingPrice = 21630 and rangeSize = 71:
Copy
correctedBasePrice = math.floor(21630 / 71) * 71 = 304 * 71 = 21584
Drawing Levels:
The indicator draws horizontal lines at intervals of the range size above and below the corrected base price.
For example, if rangeSize = 71 and maxLevels = 5, the levels will be drawn at:
Copy
21584 - (5 * 71) = 21249
21584 - (4 * 71) = 21320
...
21584 + (5 * 71) = 21939
Midpoint Lines:
If enabled, the indicator draws midpoint lines between the main levels.
For example, if the main levels are at 21584 and 21655, the midpoint line will be at:
Copy
(21584 + 21655) / 2 = 21619.5
Dual Ranges:
If you enable both ranges, the indicator will draw levels for both range sizes simultaneously.
For example, if rangeSize1 = 71 and rangeSize2 = 29, the indicator will draw two sets of levels:
Levels at intervals of 71 (e.g., 21584, 21655, 21726, ...).
Levels at intervals of 29 (e.g., 21634, 21663, 21692, ...).
Example Use Case:
Imagine you're trading a stock or cryptocurrency, and you want to identify key support and resistance levels based on a specific price range. Here's how you can use this indicator:
Set the Starting Price:
For example, if the current price is 21630, you can set this as the starting price.
Define the Range Size:
If you believe the price moves in increments of 71, set rangeSize1 = 71.
If you also want to track smaller increments of 29, set rangeSize2 = 29.
Enable Midpoint Lines:
If you want to see the midpoint between the main levels, enable Show Midpoint Line.
Customize Line Styles:
Choose different colors and styles for the main levels and midpoint lines to make them visually distinct.
Analyze the Chart:
The indicator will draw horizontal lines at the specified intervals, helping you identify potential support, resistance, and midpoint levels.
Why Is This Useful?
Support and Resistance Levels:
The horizontal lines act as dynamic support and resistance levels based on the range size you define.
Price Targets:
You can use the levels to identify potential price targets or areas where the price might reverse.
Midpoint Analysis:
The midpoint lines can help you identify areas of consolidation or potential breakout points.
Flexibility:
You can customize the range sizes, colors, and styles to suit your trading strategy.
Summary:
This indicator is a powerful tool for traders who want to visualize price levels and midpoints based on a specific range size. It helps you identify key levels for support, resistance, and potential price targets, making it easier to plan your trades.
Nota Keluaran
What Does This Indicator Do?This indicator draws horizontal price levels on your chart based on a starting price and a range size that you define. It can also draw midpoint lines between the main levels if enabled. Here's a breakdown of its functionality:
Key Features:
Starting Price:
You define a starting price (e.g., 21630).
The indicator calculates a corrected base price by rounding the starting price to the nearest multiple of the range size.
Range Size:
You define a range size (e.g., 71).
The indicator draws horizontal lines at intervals of the range size above and below the corrected base price.
Dual Ranges:
You can define two range sizes (e.g., 71 and 29).
The indicator can draw levels for both ranges simultaneously or individually, depending on your settings.
Midpoint Lines:
If enabled, the indicator draws midpoint lines between the main levels.
For example, if the main levels are at 21584 and 21655, the midpoint line will be at 21619.5.
Customizable Styles:
You can customize the line style (solid, dotted, dashed) and color for both the main levels and midpoint lines.
Dynamic Levels:
The levels are recalculated and redrawn dynamically based on the starting price and range size.
How It Works:
Corrected Base Price Calculation:
The indicator calculates the corrected base price using the formula:
pinescript
Copy
correctedBasePrice = math.floor(startingPrice / rangeSize) * rangeSize
For example, if startingPrice = 21630 and rangeSize = 71:
Copy
correctedBasePrice = math.floor(21630 / 71) * 71 = 304 * 71 = 21584
Drawing Levels:
The indicator draws horizontal lines at intervals of the range size above and below the corrected base price.
For example, if rangeSize = 71 and maxLevels = 5, the levels will be drawn at:
Copy
21584 - (5 * 71) = 21249
21584 - (4 * 71) = 21320
...
21584 + (5 * 71) = 21939
Midpoint Lines:
If enabled, the indicator draws midpoint lines between the main levels.
For example, if the main levels are at 21584 and 21655, the midpoint line will be at:
Copy
(21584 + 21655) / 2 = 21619.5
Dual Ranges:
If you enable both ranges, the indicator will draw levels for both range sizes simultaneously.
For example, if rangeSize1 = 71 and rangeSize2 = 29, the indicator will draw two sets of levels:
Levels at intervals of 71 (e.g., 21584, 21655, 21726, ...).
Levels at intervals of 29 (e.g., 21634, 21663, 21692, ...).
Example Use Case:
Imagine you're trading a stock or cryptocurrency, and you want to identify key support and resistance levels based on a specific price range. Here's how you can use this indicator:
Set the Starting Price:
For example, if the current price is 21630, you can set this as the starting price.
Define the Range Size:
If you believe the price moves in increments of 71, set rangeSize1 = 71.
If you also want to track smaller increments of 29, set rangeSize2 = 29.
Enable Midpoint Lines:
If you want to see the midpoint between the main levels, enable Show Midpoint Line.
Customize Line Styles:
Choose different colors and styles for the main levels and midpoint lines to make them visually distinct.
Analyze the Chart:
The indicator will draw horizontal lines at the specified intervals, helping you identify potential support, resistance, and midpoint levels.
Why Is This Useful?
Support and Resistance Levels:
The horizontal lines act as dynamic support and resistance levels based on the range size you define.
Price Targets:
You can use the levels to identify potential price targets or areas where the price might reverse.
Midpoint Analysis:
The midpoint lines can help you identify areas of consolidation or potential breakout points.
Flexibility:
You can customize the range sizes, colors, and styles to suit your trading strategy.
Summary:
This indicator is a powerful tool for traders who want to visualize price levels and midpoints based on a specific range size. It helps you identify key levels for support, resistance, and potential price targets, making it easier to plan your trades.
Nota Keluaran
The latest update to the script introduces independent control over midpoint lines for each range. This means you can now choose to show or hide midpoint lines for Range 1 and Range 2 separately, even if both ranges are displayed on the chart. Here's a detailed description of the changes:Key Updates:
Added Two New Inputs:
showMidpointRange1: A toggle to enable or disable midpoint lines for Range 1.
showMidpointRange2: A toggle to enable or disable midpoint lines for Range 2.
Independent Midpoint Control:
You can now choose to show midpoint lines for Range 1, Range 2, or both, regardless of whether the main levels for both ranges are displayed.
For example:
You can display Range 1 with midpoint lines and Range 2 without midpoint lines.
Or, you can display Range 2 with midpoint lines and Range 1 without midpoint lines.
Updated Midpoint Line Logic:
The script now checks the showMidpointRange1 and showMidpointRange2 inputs before drawing midpoint lines for each range.
Midpoint lines are drawn only if the corresponding toggle is enabled.
How It Works:
Range 1:
If showRange1 is enabled, the script draws the main levels for Range 1.
If showMidpointRange1 is also enabled, the script draws midpoint lines between the main levels of Range 1.
Range 2:
If showRange2 is enabled, the script draws the main levels for Range 2.
If showMidpointRange2 is also enabled, the script draws midpoint lines between the main levels of Range 2.
Example Use Cases:
Show Midpoint Lines for Range 1 Only:
Set showRange1 = true and showMidpointRange1 = true.
Set showRange2 = true and showMidpointRange2 = false.
Result: The script will display main levels and midpoint lines for Range 1, but only main levels for Range 2.
Show Midpoint Lines for Range 2 Only:
Set showRange1 = true and showMidpointRange1 = false.
Set showRange2 = true and showMidpointRange2 = true.
Result: The script will display main levels for Range 1 without midpoint lines, and main levels with midpoint lines for Range 2.
Show Midpoint Lines for Both Ranges:
Set showRange1 = true and showMidpointRange1 = true.
Set showRange2 = true and showMidpointRange2 = true.
Result: The script will display main levels and midpoint lines for both Range 1 and Range 2.
Hide Midpoint Lines for Both Ranges:
Set showRange1 = true and showMidpointRange1 = false.
Set showRange2 = true and showMidpointRange2 = false.
Result: The script will display only the main levels for both Range 1 and Range 2, with no midpoint lines.
Benefits of the Update:
Flexibility:
You can now customize the display of midpoint lines for each range independently, giving you more control over the visual representation of the levels.
Clutter Reduction:
If you only need midpoint lines for one range, you can disable them for the other range to reduce clutter on the chart.
Customization:
You can mix and match the display of midpoint lines based on your trading strategy or analysis needs.
Nota Keluaran
correctedNota Keluaran
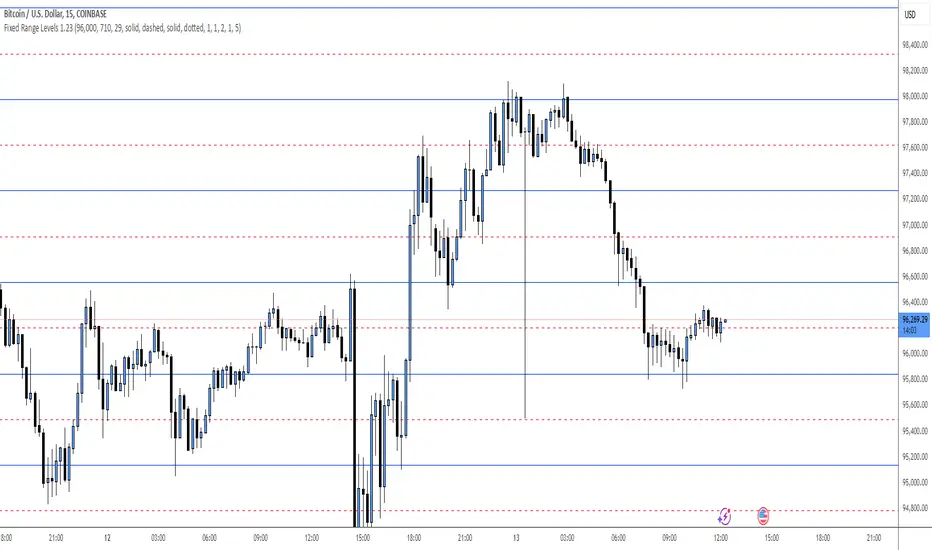
Adde clear image Nota Keluaran
chart with a fixed 710 range enabledSkrip sumber terbuka
Dalam semangat TradingView sebenar, pencipta skrip ini telah menjadikannya sumber terbuka, jadi pedagang boleh menilai dan mengesahkan kefungsiannya. Terima kasih kepada penulis! Walaupuan anda boleh menggunakan secara percuma, ingat bahawa penerbitan semula kod ini tertakluk kepada Peraturan Dalaman.
Penafian
Maklumat dan penerbitan adalah tidak bertujuan, dan tidak membentuk, nasihat atau cadangan kewangan, pelaburan, dagangan atau jenis lain yang diberikan atau disahkan oleh TradingView. Baca lebih dalam Terma Penggunaan.
Skrip sumber terbuka
Dalam semangat TradingView sebenar, pencipta skrip ini telah menjadikannya sumber terbuka, jadi pedagang boleh menilai dan mengesahkan kefungsiannya. Terima kasih kepada penulis! Walaupuan anda boleh menggunakan secara percuma, ingat bahawa penerbitan semula kod ini tertakluk kepada Peraturan Dalaman.
Penafian
Maklumat dan penerbitan adalah tidak bertujuan, dan tidak membentuk, nasihat atau cadangan kewangan, pelaburan, dagangan atau jenis lain yang diberikan atau disahkan oleh TradingView. Baca lebih dalam Terma Penggunaan.