OPEN-SOURCE SCRIPT
HILo Ema Double Squeeze Bands
HILo Ema Double Squeeze Bands
This advanced technical indicator is a powerful variation of "HiLo Ema squeeze bands" that combines the best elements of Donchian channels and EMAs. It's specially designed to identify price squeezes before significant market moves while providing dynamic support/resistance levels and predictive price targets.
Indicator Concept:
The indicator initializes EMAs at each new high or low - the upper EMA tracks highs while the lower EMA tracks lows. The price range between upper and lower bands is divided into 4 equal zones by these lines:
Upper2 (uppermost line)
Upper1 (upper quartile)
Middle (center line)
Lower1 (lower quartile)
Lower2 (lowermost line)
This creates a more trend-responsive alternative to traditional Donchian channels with clearly defined zones for trade planning.
Key Features:
Dual EMA Band System: Utilizes both short-term and long-term EMAs to create adaptive price channels that respond to different market cycles
Quartile Divisions: Each band set includes middle lines and quartile divisions for more precise entry and exit points
Customizable Parameters: Easily adjust EMA periods and display options to suit your trading style and timeframe
Visual Color Zones: Clear color-coded zones help quickly identify bullish and bearish areas
Optional Extra Divisions: Add more granular internal lines (eighth divisions) for enhanced precision with longer EMA periods
Price Labels Option: Display exact price values for key levels directly on the chart
Price Target Prediction:
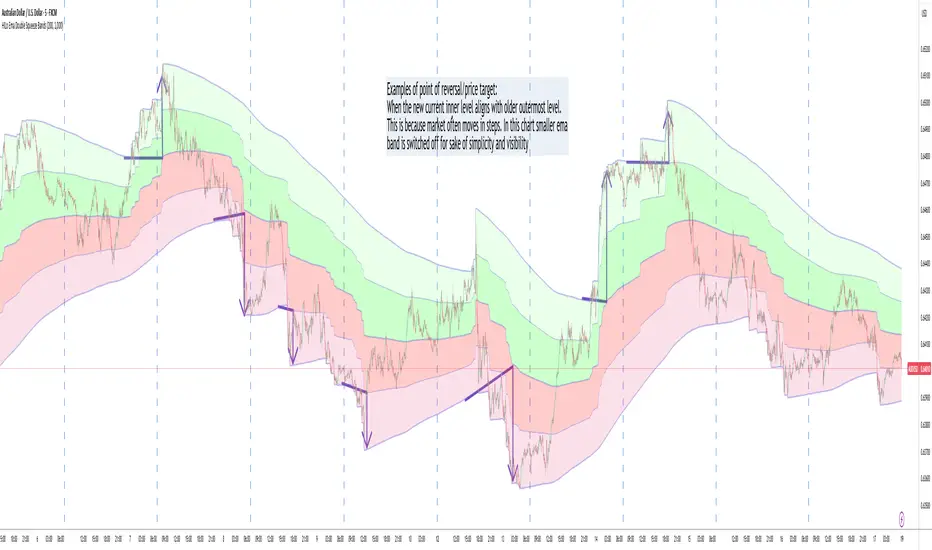
One of the most valuable features of this indicator is its ability to help predict potential reversal points:
When price breaks above the Upper2 level, look for potential reversals when the new Upper1 or Middle line aligns with previous Upper2 levels
When price breaks below the Lower2 level, look for potential reversals when the new Lower1 or Middle line aligns with previous Lower2 levels
Settings Guide:
Recommended Settings: 200 for Short EMA, 1000 for Long EMA works extremely well across most timeframes and symbols
Display options allow you to show/hide either band system based on your analysis preferences
The new option to divide the long EMA range into 8 parts instead of 4 is particularly useful when:
Long EMA period is >500
Short EMA is switched off and long EMA is used independently
Perfect for swing traders and position traders looking for a more sophisticated volatility-based overlay that adapts to changing market conditions and provides predictive reversal levels.
Note: This indicator works well across multiple timeframes but is especially effective on H4, Daily and Weekly charts for trend trading.
This advanced technical indicator is a powerful variation of "HiLo Ema squeeze bands" that combines the best elements of Donchian channels and EMAs. It's specially designed to identify price squeezes before significant market moves while providing dynamic support/resistance levels and predictive price targets.
Indicator Concept:
The indicator initializes EMAs at each new high or low - the upper EMA tracks highs while the lower EMA tracks lows. The price range between upper and lower bands is divided into 4 equal zones by these lines:
Upper2 (uppermost line)
Upper1 (upper quartile)
Middle (center line)
Lower1 (lower quartile)
Lower2 (lowermost line)
This creates a more trend-responsive alternative to traditional Donchian channels with clearly defined zones for trade planning.
Key Features:
Dual EMA Band System: Utilizes both short-term and long-term EMAs to create adaptive price channels that respond to different market cycles
Quartile Divisions: Each band set includes middle lines and quartile divisions for more precise entry and exit points
Customizable Parameters: Easily adjust EMA periods and display options to suit your trading style and timeframe
Visual Color Zones: Clear color-coded zones help quickly identify bullish and bearish areas
Optional Extra Divisions: Add more granular internal lines (eighth divisions) for enhanced precision with longer EMA periods
Price Labels Option: Display exact price values for key levels directly on the chart
Price Target Prediction:
One of the most valuable features of this indicator is its ability to help predict potential reversal points:
When price breaks above the Upper2 level, look for potential reversals when the new Upper1 or Middle line aligns with previous Upper2 levels
When price breaks below the Lower2 level, look for potential reversals when the new Lower1 or Middle line aligns with previous Lower2 levels
Settings Guide:
Recommended Settings: 200 for Short EMA, 1000 for Long EMA works extremely well across most timeframes and symbols
Display options allow you to show/hide either band system based on your analysis preferences
The new option to divide the long EMA range into 8 parts instead of 4 is particularly useful when:
Long EMA period is >500
Short EMA is switched off and long EMA is used independently
Perfect for swing traders and position traders looking for a more sophisticated volatility-based overlay that adapts to changing market conditions and provides predictive reversal levels.
Note: This indicator works well across multiple timeframes but is especially effective on H4, Daily and Weekly charts for trend trading.
Skrip sumber terbuka
Dalam semangat TradingView sebenar, pencipta skrip ini telah menjadikannya sumber terbuka, jadi pedagang boleh menilai dan mengesahkan kefungsiannya. Terima kasih kepada penulis! Walaupuan anda boleh menggunakan secara percuma, ingat bahawa penerbitan semula kod ini tertakluk kepada Peraturan Dalaman.
Penafian
Maklumat dan penerbitan adalah tidak bertujuan, dan tidak membentuk, nasihat atau cadangan kewangan, pelaburan, dagangan atau jenis lain yang diberikan atau disahkan oleh TradingView. Baca lebih dalam Terma Penggunaan.