3D WAVE-PM Meow Mix [acatwithwithcharts]
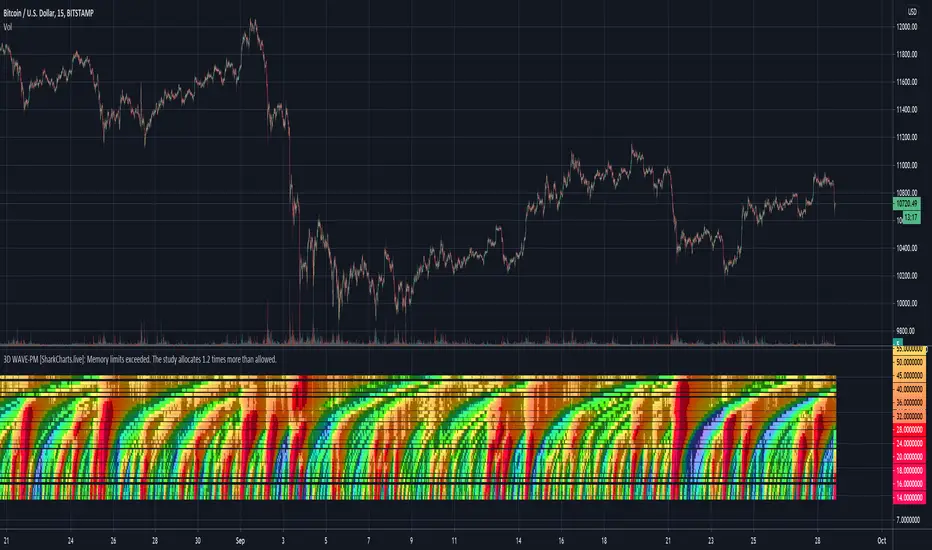
(It may be necessary to move the scale around to see the indicator - it ranges from 14 to 600 and the scale on the chart seems to default to a range below it.)
It's experimental, it's a proof of concept for heatmap versions of indicators, it has a tendency to freeze up, and it gives a great deal of information in one snapshot (mcuh of which I'm still working out how best to use). It is particularly good at presenting a bird's eye view of the significance of a given movement relative to how much of an impact it has on higher period volatility expansions.
I'm publishing this as Invite-Only with a few specific people already in mind to help experiment with the concept, and do not have immediate plans for opening broad access to it.
I added a 1 bar forward offset on the plots. They now line up correctly rather than appearing to repaint the previous bar.
This calculation occasionally times out the indicator. Changing symbols or TFs will reload it and generally resolve the issue. If you just want to use ordinary SMA and STDEV, using the "lite" version of this indicator should avoid this issue completely.
I'm excited to announce that we're putting the finishing touches on a subscription service for the volatility theory indicators, and assuming no hiccups will launch them within days. Subscriptions will be available in several packages through SharkCharts.live
Current pricing and subscription details will be kept up-to-date on SharkCharts.live
Skrip jemputan sahaja
Hanya pengguna disahkan oleh penulis boleh mengakses skrip ini. Anda perlu memohon dan mendapatkan kebenaran untuk menggunakannya. Keizinan selalunya diberikan selepas pembayaran. Untuk lebih butiran, ikuti arahan penulis di bawah atau hubungi acatwithcharts secara terus.
TradingView TIDAK menyarankan pembayaran atau penggunaan skrip kecuali anda mempercayai sepenuhnya penulis dan memahami bagaimana ia berfungsi. Anda juga boleh menjumpai alternatif sumber terbuka dan percuma yang lain di dalam skrip komuniti kami.
Arahan penulis
Feel free to reach out to me with any questions; more information is available on the SharkCharts website and the SharkCharts discord discord.gg/YVpTeSK
Penafian
Skrip jemputan sahaja
Hanya pengguna disahkan oleh penulis boleh mengakses skrip ini. Anda perlu memohon dan mendapatkan kebenaran untuk menggunakannya. Keizinan selalunya diberikan selepas pembayaran. Untuk lebih butiran, ikuti arahan penulis di bawah atau hubungi acatwithcharts secara terus.
TradingView TIDAK menyarankan pembayaran atau penggunaan skrip kecuali anda mempercayai sepenuhnya penulis dan memahami bagaimana ia berfungsi. Anda juga boleh menjumpai alternatif sumber terbuka dan percuma yang lain di dalam skrip komuniti kami.
Arahan penulis
Feel free to reach out to me with any questions; more information is available on the SharkCharts website and the SharkCharts discord discord.gg/YVpTeSK