OPEN-SOURCE SCRIPT
Telah dikemas kini Fixed Fibonacci Support Resistance
I took the formula of the fibonacci from LonesomeTheBlue and made this script. You can take a look at his indicator here: 
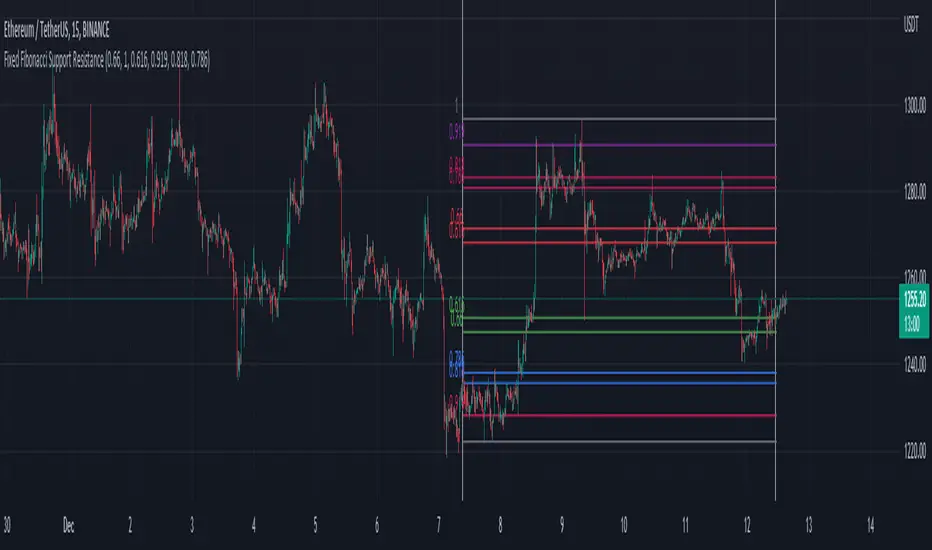
When you first add the indicator on the chart, click on the chart to select the first date and then the second date. It will then calculate the fibonacci support and resistance of the range you choose. You can also choose the date inside the inputs.
Be sure the first date is before the second date, otherwise it won't be able to show the fibonacci. If that happen, choose a correct date in the inputs.
Nota Keluaran
The original code is from LonesomeTheBlue in the Fibonacci Levels MTF script.Nota Keluaran
-Added a bool to extend the fibonacci to the right. -I changed the fibonacci to start from start time to end time instead of starting at end time.
-Added a bool to show/hide the start/end white line.
Skrip sumber terbuka
Dalam semangat TradingView sebenar, pencipta skrip ini telah menjadikannya sumber terbuka, jadi pedagang boleh menilai dan mengesahkan kefungsiannya. Terima kasih kepada penulis! Walaupuan anda boleh menggunakan secara percuma, ingat bahawa penerbitan semula kod ini tertakluk kepada Peraturan Dalaman.
Penafian
Maklumat dan penerbitan adalah tidak bertujuan, dan tidak membentuk, nasihat atau cadangan kewangan, pelaburan, dagangan atau jenis lain yang diberikan atau disahkan oleh TradingView. Baca lebih dalam Terma Penggunaan.