PROTECTED SOURCE SCRIPT
Gabriel's Asset Rotation System
📈 Gabriel's Asset Rotation System
Overview
Gabriel’s Asset Rotation System is an advanced multi-asset trend-following tool that dynamically ranks and rotates up to 6 assets (plus USD) based on a customizable trend scoring matrix. Using enhanced signal detection techniques like Cauchy-weighted Supertrend, Jurík RSX, Fisherized CCI, Kalman-filtered PSAR, and Dynamic DMI Smoothing, the system identifies the most dominant asset and simulates strategy equity performance compared to buy-and-hold benchmarks.
🔍 Key Features
✅ Multi-Asset Rotation: Analyze up to 6 symbols and USD simultaneously.
✅ Relative Strength Matrix: Compares every asset against each other to find outperformers.
✅ Custom Trend Engine:
Jurik RSX with advanced RSX logic
Fisherized CCI for momentum confirmation
Kalman-smoothed PSAR for trend bias
SuperTrend using a Cauchy Moving Average
Smoothed DMI signal across looped periods (10–17)
✅ Dynamic Best Asset Detection: Identifies and tracks the asset with the highest trend score over time.
✅ Performance Table: Displays Sharpe, Sortino, and Omega Ratios along with drawdowns and means for both strategy and each asset.
✅ Visual Trend Matrix: Tabular view of asset strength comparisons against each other + final scoring.
✅ Realistic Strategy Equity Curve: Tracks performance assuming full capital rotation into the best asset.
✅ Alerts: Get notified when the top-performing asset changes.
⚙️ Inputs
🔹 Assets: Customize 6 tickers (crypto, stocks, ETFs, etc.)
🔹 Trend Classification Method:
RSI
CCI
SuperTrend
DMI
PSAR
or use all together
🔹 Jurik RSX Length
🔹 Fisherized CCI Length
🔹 Cauchy MA Gamma and ATR Settings
🔹 DMI Range and MA Type (SMA, EMA, HMA, etc.)
🔹 PSAR Parameters with Kalman smoothing
🔹 Custom Backtest Start Date
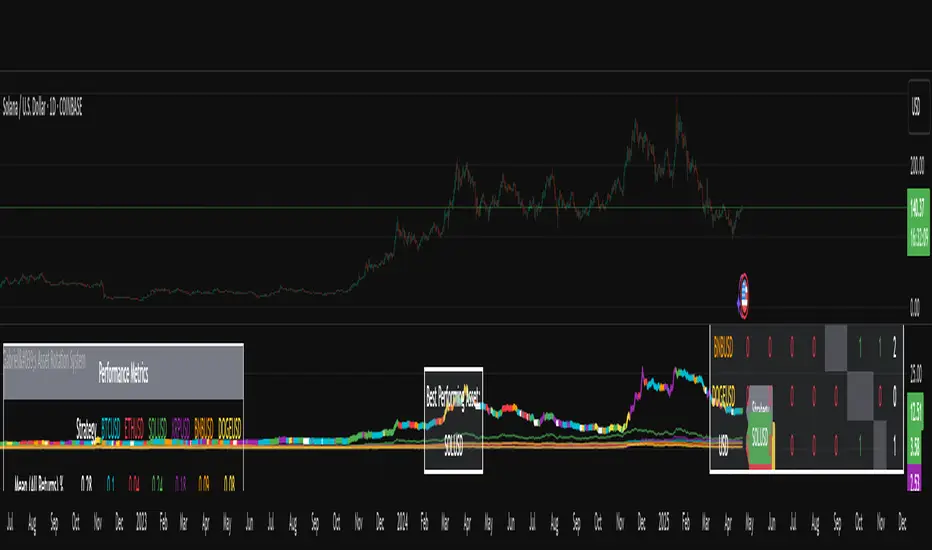
📊 Outputs
Plot 1: Best Asset Equity (colored dynamically)
Plot 2–7: Buy & Hold Curves for each asset (with labels)
Tables:
Rotation Matrix (bottom-right)
Best Performing Asset (bottom-center)
Performance Metrics Table (optional toggle)
🧠 Use Case Ideas
🔁 Dynamic Portfolio Rebalancing
⚖️ Compare Risk-Adjusted Returns Across Crypto or Stocks
🧪 Backtest Rotation Hypotheses
🚀 Identify Strongest Breakout Assets in Trend Environments
📉 Avoid Weakening Assets with Rising Drawdowns
🚨 Alerts
🔔 "New Optimal Asset": Triggers when a new top-ranking asset replaces the current one.
Overview
Gabriel’s Asset Rotation System is an advanced multi-asset trend-following tool that dynamically ranks and rotates up to 6 assets (plus USD) based on a customizable trend scoring matrix. Using enhanced signal detection techniques like Cauchy-weighted Supertrend, Jurík RSX, Fisherized CCI, Kalman-filtered PSAR, and Dynamic DMI Smoothing, the system identifies the most dominant asset and simulates strategy equity performance compared to buy-and-hold benchmarks.
🔍 Key Features
✅ Multi-Asset Rotation: Analyze up to 6 symbols and USD simultaneously.
✅ Relative Strength Matrix: Compares every asset against each other to find outperformers.
✅ Custom Trend Engine:
Jurik RSX with advanced RSX logic
Fisherized CCI for momentum confirmation
Kalman-smoothed PSAR for trend bias
SuperTrend using a Cauchy Moving Average
Smoothed DMI signal across looped periods (10–17)
✅ Dynamic Best Asset Detection: Identifies and tracks the asset with the highest trend score over time.
✅ Performance Table: Displays Sharpe, Sortino, and Omega Ratios along with drawdowns and means for both strategy and each asset.
✅ Visual Trend Matrix: Tabular view of asset strength comparisons against each other + final scoring.
✅ Realistic Strategy Equity Curve: Tracks performance assuming full capital rotation into the best asset.
✅ Alerts: Get notified when the top-performing asset changes.
⚙️ Inputs
🔹 Assets: Customize 6 tickers (crypto, stocks, ETFs, etc.)
🔹 Trend Classification Method:
RSI
CCI
SuperTrend
DMI
PSAR
or use all together
🔹 Jurik RSX Length
🔹 Fisherized CCI Length
🔹 Cauchy MA Gamma and ATR Settings
🔹 DMI Range and MA Type (SMA, EMA, HMA, etc.)
🔹 PSAR Parameters with Kalman smoothing
🔹 Custom Backtest Start Date
📊 Outputs
Plot 1: Best Asset Equity (colored dynamically)
Plot 2–7: Buy & Hold Curves for each asset (with labels)
Tables:
Rotation Matrix (bottom-right)
Best Performing Asset (bottom-center)
Performance Metrics Table (optional toggle)
🧠 Use Case Ideas
🔁 Dynamic Portfolio Rebalancing
⚖️ Compare Risk-Adjusted Returns Across Crypto or Stocks
🧪 Backtest Rotation Hypotheses
🚀 Identify Strongest Breakout Assets in Trend Environments
📉 Avoid Weakening Assets with Rising Drawdowns
🚨 Alerts
🔔 "New Optimal Asset": Triggers when a new top-ranking asset replaces the current one.
Skrip dilindungi
Skrip ini diterbitkan sebagai sumber tertutup. Akan tetapi, anda boleh menggunakannya secara bebas dan tanpa apa-apa had – ketahui lebih di sini.
Gabriel Amadeus
The Real World - Stocks Campus:
Stocks, Options, Futures, Forex, Crypto, this is what we trade.
Learn profitable trading systems or build your own, just like I did.
jointherealworld.com/?a=f7jkjpg8kh
The Real World - Stocks Campus:
Stocks, Options, Futures, Forex, Crypto, this is what we trade.
Learn profitable trading systems or build your own, just like I did.
jointherealworld.com/?a=f7jkjpg8kh
Penafian
Maklumat dan penerbitan adalah tidak bertujuan, dan tidak membentuk, nasihat atau cadangan kewangan, pelaburan, dagangan atau jenis lain yang diberikan atau disahkan oleh TradingView. Baca lebih dalam Terma Penggunaan.