OPEN-SOURCE SCRIPT
3/10 Osc
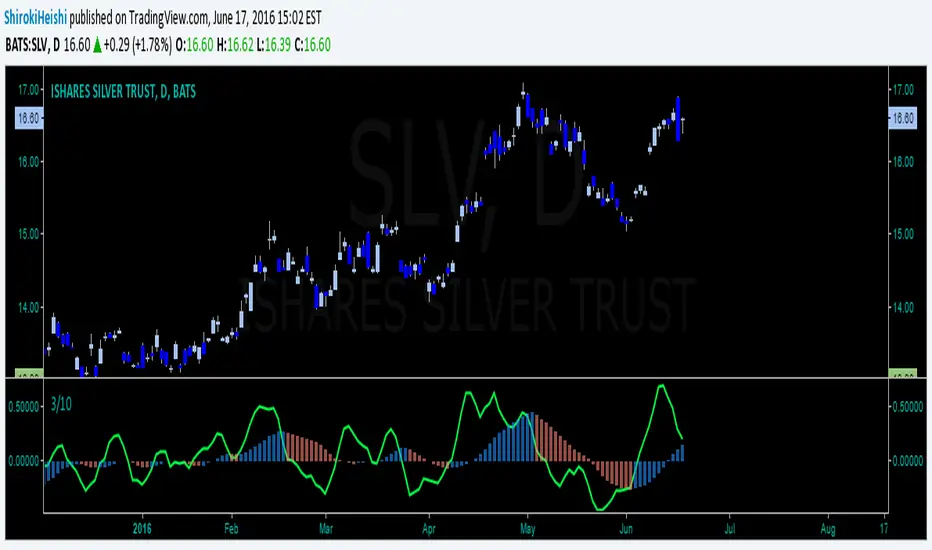
Constance Brown liked to use this by taking the first break of the zero line by the 3/10 oscillator in the direction of the trend-line relative to above or below zero. The similarities between the histogram and the MACD histogram are striking and its use is almost the same. Useful for seeing divergence in the same way noted by DR. Elder, take the first opposite colored bar after divergence which he stated was to have one peak lower than the previous but must break below zero in between. (opposite is true for bearish play)
I offer no updates to its use. this is the 3/10 oscillator popularized by Constance Brown. The only customization done here is cosmetic. This is just a copy for the user who saw my screen and wanted it exactly how mine was.
Enjoy responsibly, and as always, if you use this, take responsibility for your actions for good or ill, because I cannot be.
Good trading all,
Shiroki
Skrip sumber terbuka
Dalam semangat sebenar TradingView, pencipta skrip ini telah menjadikannya sumber terbuka supaya pedagang dapat menilai dan mengesahkan kefungsiannya. Terima kasih kepada penulis! Walaupun anda boleh menggunakannya secara percuma, ingat bahawa menerbitkan semula kod ini adalah tertakluk kepada Peraturan Dalaman kami.
Penafian
Maklumat dan penerbitan adalah tidak dimaksudkan untuk menjadi, dan tidak membentuk, nasihat untuk kewangan, pelaburan, perdagangan dan jenis-jenis lain atau cadangan yang dibekalkan atau disahkan oleh TradingView. Baca dengan lebih lanjut di Terma Penggunaan.