OPEN-SOURCE SCRIPT
ALMA Trend-box
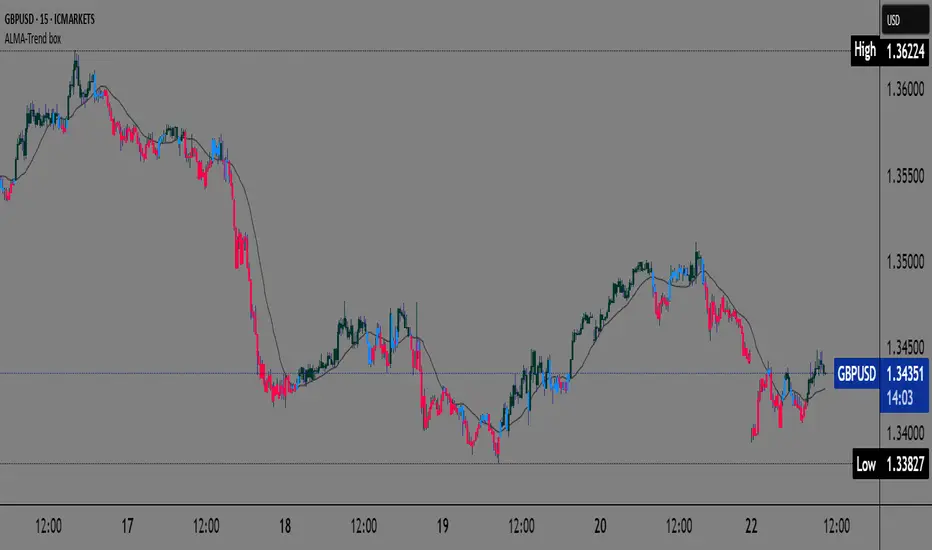
ALMA Trend-box — an innovative indicator for detecting trend and consolidation based on the ALMA moving average
This indicator combines the Adaptive Laguerre Moving Average (ALMA) with unique visual representations of trend and consolidation zones, providing traders with clearer and deeper insight into current market conditions.
Originality and Usefulness
Unlike classic indicators based on simple moving averages, ALMA uses a Gaussian weighting function and an offset parameter to reduce lag, resulting in smoother and more accurate trend signals. This indicator not only plots the ALMA but also analyzes the slope angle of the ALMA line, combining it with the price’s position relative to the moving average to identify three key market states:
Uptrend (bullish): when the ALMA slope angle is above a defined threshold and the price is above ALMA,
Downtrend (bearish): when the slope angle is below a negative threshold and the price is below ALMA,
Consolidation or sideways trend: when neither of the above conditions is met.
A special contribution is the automatic identification of consolidation zones (periods of weak trend or transition between bullish and bearish phases), visually represented by blue-colored candlesticks on the chart. This feature can help traders better recognize moments when the market is indecisive and adjust their strategies accordingly.
How the Indicator Works
ALMA is calculated using user-defined parameters — length, offset, and sigma — which can be adjusted for different timeframes and instruments.
The slope angle of the ALMA line is calculated based on the difference between the current and previous ALMA values, converted into degrees.
Based on the slope angle and the relative price position to ALMA, the indicator determines the trend type and changes the candle colors accordingly:
Green for bullish (uptrend),
Red for bearish (downtrend),
Blue for sideways trend (consolidation).
When the slope angle falls within a certain range and the price behavior contradicts the trend, the indicator detects consolidation and displays it graphically through semi-transparent boxes and background color.
How to Use This Indicator
Use candle colors for quick identification of the current trend and potential trend reversals.
Pay attention to consolidation zones marked by boxes (blue candles), as these are potential signals for trend breaks or preparation for stronger price moves.
ALMA parameters can be adjusted depending on the timeframe and market volatility, providing flexibility in analysis.
The indicator is useful for both short-term scalping strategies and longer-term trend monitoring and position management.
Why This Indicator is Useful
Many existing trend indicators do not consider the slope angle of the moving average as a quantitative measure of trend strength, nor do they automatically detect consolidations as separate zones. ALMA Trend-box fills this gap by combining sophisticated mathematical processing with simple and intuitive visual representation. This way, users get a tool that helps make decisions based on more objective criteria of trend and consolidation rather than just price location relative to averages.
Skrip sumber terbuka
Dalam semangat TradingView sebenar, pencipta skrip ini telah menjadikannya sumber terbuka, jadi pedagang boleh menilai dan mengesahkan kefungsiannya. Terima kasih kepada penulis! Walaupuan anda boleh menggunakan secara percuma, ingat bahawa penerbitan semula kod ini tertakluk kepada Peraturan Dalaman.
Free telegram channel t.me/alexmasterforex
Penafian
Maklumat dan penerbitan adalah tidak bertujuan, dan tidak membentuk, nasihat atau cadangan kewangan, pelaburan, dagangan atau jenis lain yang diberikan atau disahkan oleh TradingView. Baca lebih dalam Terma Penggunaan.