Hierarchical Hidden Markov Model - Probability Cone
The Hierarchical Hidden Markov Model - Probability Cone Indicator employs Hierarchical Hidden Markov Models for forecasting future price movements in financial markets. HHMMs are statistical tools that predict transitions between hidden states, such as different market regimes, based on observed data. This makes them valuable for understanding market behaviours and projecting future price trajectories. As discussed in the Hierarchical Hidden Markov Model indicator, HHMMs predict future states and their associated outputs based on the current state and model parameters. This tool is fundamentally very similar to the traditional HMM. The application of the HHMM for generating a probability cone forecast is therefore also fundamentally the same between HMM and HHMM. Despite their significant similarity I will go through the same fundamental examples of how probability cone is generated for the HHMM as I did for the HMM probability cone.
As you might know by now the probability cone indicator uses the knowledge about the current identified "state" or "regime" and with the help of transition probabilities, emission probabilities and initial probabilities generate a probabilistic forecast of the expected future price movements. To better understand the behind the Probability Cone we encourage you to use and learn about our free version of the Probability Cone as well as for even deeper understanding the Probability Cone Pro.
WHAT ARE REGIME DEPENDENT FORECASTS
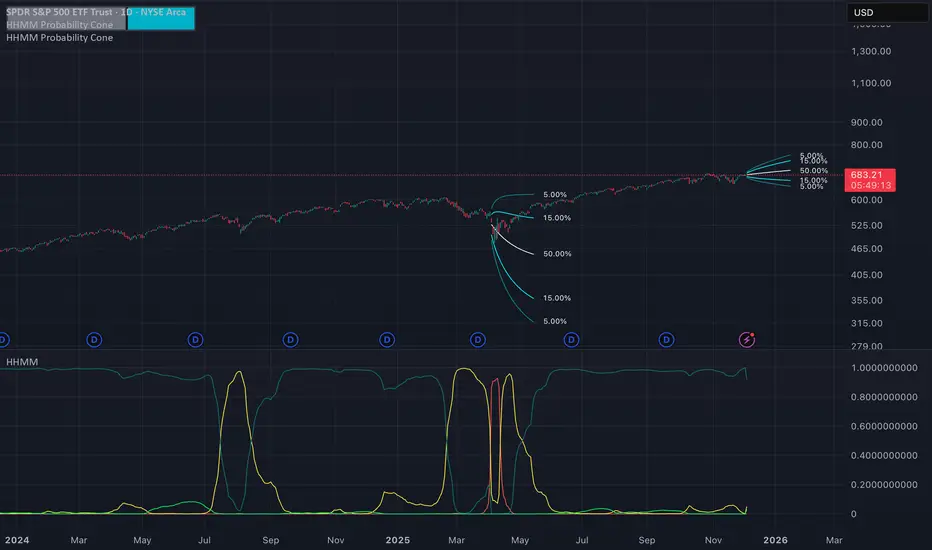
We established that the indicator creates probabilistic forecasts of future price movements dependent on the current identified "state" or market "regime" via the Hidden Markov Model. In the image below we can see an example.
In this example we can see 4 different probability cones forecasting a 70% and 90% probability range (15% and 5% quantiles respectively). What you may notice is that the 4 probability cones look vastly different, despite using the same probability ranges as well as being generated from the same model trained on virtually the same data. What allows for this difference in the forecast, is conditioning the forecast on the current most likely identified state by the HHMM.
The first most cone is generating a forecast taking into account that the model identified the current market condition to be a extremely low in volatility this is a characteristic of the state identified by the light green coloured posterior probability. The second cone is significantly wider as well as has a negative drift, this is the case because that state identified by the red posterior probability is characterised by the most extreme volatility along with significant negative returns. The cone after that remains quite wide however is again associated with positive returns, this is characteristic of the state that the model identified via a high yelow coloured posterior probability. The last probability cone is again generated from a state that is characterised by quite low volatility albeit not the lowest. We can also see the state associated with that behaviour is identified by the high dark green posterior probability which is the highest at that time.
NOTE! Those are within sample forecasts, you can find more information on the difference between within sample model fit and out of sample prediction in the HHMM indicator description
This indicator also allows you to specify whether you wish to display probability based labels at the edges of the cone or whether you would prefer to display percent change based labels. With percent change labels you get the exact percentage value of the probabilistic increase or decrease of the price. See the example below
BARS BACK OFFSET vs DATE BASED OFFSET
The cones position can be offset by specifying the number of bars we wish to move it back similarly as with the rest of probability cone indicators. This indicator has however an additional, date based offset implemented. A user can therefore specify the position of the cone by specifying a date in the settings. The advantage of using the date based offset is that once it is turned on the user can also slide the cone up and down the chart with their mouse without having to manually adjust the date in the settings.
DIFFICULTIES WITH GENERATING FORECASTS (advanced):
The estimation of the probability cone, gets more difficult the more complex the model gets. A simple normal distribution probability cone can scale the distribution over time by simply multiplying the drift by the number of time steps and the volatility by the square root of time steps we wish to forecast for. More complex distributions often have to rely on mode advanced methods like convolutions, monte carlo or other kinds of approximations.
To estimate the probability cone forecast for the Hierarchial Hidden Markov Model, the indicator integrates two primary methodologies: Gaussian approximation and importance sampling. The Gaussian approximation is utilised for estimating the central 90% of future prices. This method provides a quick and efficient estimation within this central range, capturing the most likely price movements. The gaussian approximation will result in a forecast with an equal mean and variance as the true forecast, it will however not accurately reflect higher moments like skewness and kurtosis. For that reason the tail quantiles, which represent extreme price movements beyond the central range (90%), are estimated via importance sampling. This approach ensures a more accurate estimation of the skewness and kurtosis associated with extreme scenarios. While importance sampling leverages the flexibility of Monte Carlo as well as attempts to increase its efficiency by sampling from more precise areas of the distribution, the importance sampling may still underestimate most extreme quantiles associated with the lowest probabilities which is an inherent limitation of the indicator.
Example of gaussian approximation cone for probabilities above 5% (90% range):
Example of importance sampling cone for tail probabilities lower than 5% (beyond 90% range):
WARNING!
As per usual understand that the probabilities are estimations and best guesses based on the historical data and the patterns identified by the model and do not represent the true probability which is unknown in reality.
Settings:
- Source: Data source used for the model
- Forecast Period: Number of bars ahead for generating forecasts.
- Simulation Number: Number of Monte Carlo simulations to run in the case of importance sampling
-Body Probability: Specifies the inner range of the probability cone. The probability specifies the ammount of observations that are expected to fall outside of this range
- Tail Probability: Specifies the outter range of the probability cone. When this probability is under 5%, importance sampling will turn on
- Lock Cone: When ticked on, the cone will be locked at its current position.
- Offset Cone Based on Date: When ticked on, the position of the cone will be determined by the selected date.
- Offset: When "Offset Cone Based on Date" is turned off, you can use offset setting to specify the position of the cone projection.
- Date: When "Offset Cone Based on Date" is turned on, you can use the date setting to specify the date from which the forecast starts.
- Reestimate Model Every N Bars: This is especially useful if you wish to use the indicator on lower timeframes where model estimation might take longer than for the new datapoint to arrive. In that case you can specify after how many bars the model should be reestimated.
- Training Period: Length of historical data used to train the HMM.
- Expectation Maximization Iterations: Number of iterations for the EM algorithm.
- Cone Colors: Customizable colors for the probability cone, when approximation is on and when importance sampling is on
Skrip jemputan sahaja
Hanya pengguna disahkan oleh penulis boleh mengakses skrip ini. Anda perlu memohon dan mendapatkan kebenaran untuk menggunakannya. Keizinan selalunya diberikan selepas pembayaran. Untuk lebih butiran, ikuti arahan penulis di bawah atau hubungi Motgench secara terus.
TradingView TIDAK menyarankan pembayaran atau penggunaan skrip kecuali anda mempercayai sepenuhnya penulis dan memahami bagaimana ia berfungsi. Anda juga boleh menjumpai alternatif sumber terbuka dan percuma yang lain di dalam skrip komuniti kami.
Arahan penulis
Penafian
Skrip jemputan sahaja
Hanya pengguna disahkan oleh penulis boleh mengakses skrip ini. Anda perlu memohon dan mendapatkan kebenaran untuk menggunakannya. Keizinan selalunya diberikan selepas pembayaran. Untuk lebih butiran, ikuti arahan penulis di bawah atau hubungi Motgench secara terus.
TradingView TIDAK menyarankan pembayaran atau penggunaan skrip kecuali anda mempercayai sepenuhnya penulis dan memahami bagaimana ia berfungsi. Anda juga boleh menjumpai alternatif sumber terbuka dan percuma yang lain di dalam skrip komuniti kami.