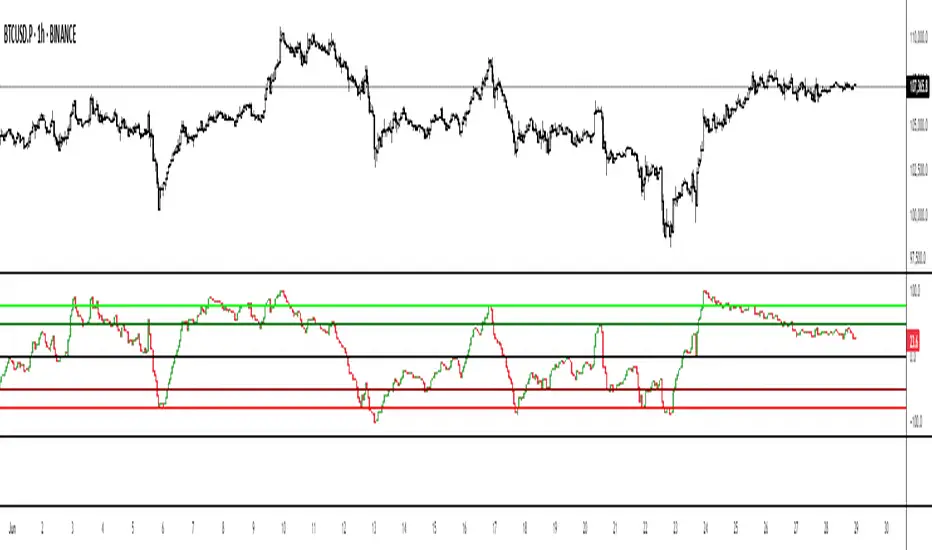
Fusion Of Momentum Oscillator [A0A-Indicator]
Key Features
Designed by A0A – Innovation at its Core
- This script reflects the visionary expertise of A0A, integrating proprietary methodologies to deliver an unparalleled trading experience.
Built to empower traders with a seamless blend of simplicity, functionality, and precision.
- Adaptable Timeframe Selection
Supports customizable timeframes to suit various trading strategies—whether you're a day trader, swing trader, or long-term investor.
Adjust the analysis to your preferred timeframe for deeper insights.
- Two Core Metrics for Market Analysis
Price: Tracks and visualizes price momentum with adjustable sensitivity and customizable periods, providing a clear view of trend strength.
Interest: Measures and highlights shifts in market activity, revealing potential areas of increased trading focus.
- Normalized Value Scale
Both metrics are normalized on a scale of -100 to 100, making them easy to interpret and directly comparable.
Offers a clear, standardized perspective on market trends and movements.
- Stunning Visual Representation
Dynamic Color Coding:
Positive and negative values for "Price" are color-coded for immediate trend recognition.
Smooth Transparency:
"Interest" is plotted as a semi-transparent area, drawing attention to key market activity changes.
Reference Levels
Horizontal markers at critical levels (-50, 0, 50) help traders easily identify zones of interest.
- Fully Customizable Aesthetics
Personalize color schemes for "Price" and "Interest" to match your visual preferences.
Create a clear and tailored visual experience that supports your trading workflow.
- Optimized for Speed and Accuracy
Built using efficient algorithms for fast, precise calculations without sacrificing performance.
Provides reliable results, even in fast-moving markets.
Why Choose the A0A Indicator?
Creator’s Legacy
Developed by A0A, this script incorporates expertise and innovation in trading technology.
Actionable Insights
Focuses on delivering signals that are clear, intuitive, and aligned with real-world market behavior.
Adaptability for All Traders
From beginners to professionals, this tool is flexible enough to meet the needs of any trader.
Perfect for Every Trading Style
Trend Followers
Stay on top of market momentum with clear visual cues.
Signal Seekers
Pinpoint potential reversal points and breakout zones with ease.
Strategic Investors
Make data-driven decisions with a focus on market behavior.
Timeframe changed from 30 to 1
Normalization Period changed from 210 to 240
Price Long Period changed from 32 to 30
Price Short Period changed from 16 to 15
Price Sensitivity Period changed from 20 to 22
Interest Slow Length changed from 32 to 30
Interest Fast Length changed from 16 to 15
Sensitivity Signal Length changed from 20 to 22
hline 66 added
hline 61.8 added
hline 38.2 added
hline -38.2 added
hline -61.8 added
hline -66 added
hline 50 removed
hline -50 removed
Normalization period changed from 240 to 480
New function: RSI, period: 48
Optimizations in the settings, better structure and finer settings
Color optimization
Price Short Period changed from 15 to 12
Price Sensitivity Period changed from 22 to 24
Interest Fast Length changed from 15 to 12
Sensitivity Signal Length changed from 22 to 24
Note: if the background color is white, please set the hlines to black.
Hline thickness optimized
Chart update
Dear Members,
I'm excited to announce the release of FOMO Indicator v2.0, a significant upgrade to our Fusion Of Momentum Oscillator. This update introduces optimized parameters, improved visuals, and enhanced responsiveness across various timeframes, making it even more effective for your trading strategies. Below, we outline the key changes from v1.4.1 to v2.0, with specific references to the Interest and Price.
Key Updates in Version 2.0
1. Timeframe Flexibility
Old (v1.4.1): Fixed default timeframe set to "1" (1-minute chart).
New (v2.0): Timeframe input now defaults to the chart's timeframe (input.timeframe(defval="")), allowing seamless adaptation to your preferred timeframe (e.g., 15min, 30min, 1h, 4h).
Why? This change ensures the indicator dynamically aligns with your chart, making it more versatile for day trading and swing trading.
2. Normalization Period Adjustment
Old (v1.4.1): Normalization period set to 480 bars.
New (v2.0): Reduced to 200 bars for better balance between responsiveness and stability.
Why? A shorter normalization period makes the indicator more sensitive to recent market movements, improving accuracy on shorter timeframes like 15min or 20min.
3. Price Enhancements
Description: The Price component, measures momentum using the Price of Change and Sensitivity.
Parameter Updates:
Price Long Period: Reduced from 30 to 24.
Price Short Period: Increased from 12 to 16.
Sensitivity Period: Reduced from 24 to 20.
Visual Improvements:
Above 0: New color (RGB: 247, 124, 128, 50) for a softer, more distinct appearance.
Below 0: New color (RGB: 129, 199, 132, 50) for better contrast.
Plot style remains style_area, but linewidth increased to 2 for clarity.
Why? These adjustments make the Price curve more responsive to market trends, especially on 1h and 4h timeframes, while the updated colors improve readability.
4. Interest Enhancements
Description: The Interest component, tracks the difference between fast and slow gauge market momentum and trend strength.
Parameter Updates:
Interest Slow Length: Reduced from 30 to 26.
Interest Fast Length: Unchanged at 12.
Signal Length: Reduced from 24 to 9.
Visual Improvements:
Color updated to a lighter, semi-transparent black for better layering.
Plot style remains style_area, with linewidth increased to 2 for emphasis.
Why? The tweaked parameters make the Interest component faster to react to price changes, ideal for shorter timeframes like 15min and 20min, while maintaining reliability on 4h charts.
5. RSI Improvements
Parameter Update: RSI period reduced from 48 to 14 for greater sensitivity.
Visual Update:
Color changed to a vibrant yellow.
Plot style switched from style_line to style_stepline for a modern, stepped appearance.
Why? A shorter RSI period aligns better with active trading on lower timeframes, and the new plot style enhances visual distinction.
6. Price-to-Interest Average Curve
New Colors:
Above 0: Darker green.
Below 0: Darker red.
Why? The updated colors provide clearer signals for trend direction, especially when combining Price and Interest data.
7. Horizontal Lines Update
Old (v1.4.1): Levels at ±66, ±61.8, ±38.2, 0.
New (v2.0):
Replaced ±38.2 with ±33.32, updated colors for better visibility:
±61.8: Red for positive, Green for negative.).
±33.32: Red for positive, Green for negative.
±66 and 0: White, solid for consistency.
Why? The ±33.32 levels align with Fibonacci-based trading strategies, offering more precise entry/exit zones or bounce area for 1h and 4h timeframes.
8. Visual and Performance Optimizations
All curves now use a consistent plotting approach with improved linewidths and transparency for better layering.
Reduced computational load by optimizing normalization calculations, ensuring smoother performance on lower timeframes like 15min and 20min.
How to Update
Replace the old v1.4.1 script with the new v2.0 script in your TradingView Pine Editor.
Adjust the timeframe input to match your chart (or leave as default for auto-adaptation).
Experiment with the updated parameters to fine-tune for your trading style.
Thank you for your continued support!
I believe FOMO v2.0 will elevate your trading experience with its refined Price and Interest components.
If you have any questions or feedback, feel free to reach out.
Happy Trading! [A0A-Indicator Team]
P.S.: Working on the FOMO Guide.
I am proud to present the latest iteration of the Fusion Of Momentum Oscillator (FOMO + DADX) [A0A_Indicator], a significant advancement in providing traders with a versatile and intuitive analytical tool.
Key Enhancements:
Immutable Core Parameters: All core parameters are hardcoded to ensure consistency and reliability, preventing any user-induced alterations and preserving the integrity of the indicator's performance.
Adaptive Normalization: The indicator dynamically adjusts its normalization process based on the selected timeframe, offering consistent sensitivity and responsiveness across various trading horizons.
Enhanced Visual Clarity: Refined color schemes and plotting styles provide clearer visual cues, facilitating quicker interpretation of market conditions and aiding in more informed decision-making.
Optimized Performance: Through codebase refinements, the indicator delivers faster computations and smoother performance, ensuring real-time responsiveness even in volatile market scenarios.
Strategic Flexibility:
Entry Opportunities: The indicator highlights overbought and oversold zones, enabling traders to identify potential entry points when the market is considered overextended in either direction.
Exit Strategies: Traders have the flexibility to determine exit points based on their individual strategies, whether that involves closing positions upon entering overbought or oversold zones or waiting for a trend reversal signal.
Neutral Zone Dynamics: The neutral zone serves as a potential area for price consolidation or reversal, offering additional context for decision-making regarding entries and exits.
Simplified Yet Informative Design:
Despite its complexity under the hood, the indicator presents all this information through a single, color-coded line. This streamlined design ensures that traders can quickly assess market conditions without being overwhelmed by multiple plots or data points.
This latest version embodies my dedication to continuous improvement, integrating user feedback and technological advancements to deliver a superior analytical experience.
Kind regards
A0A
Automatic Timeframe Adaptation: The indicator now automatically adjusts its internal parameters based on the chart's timeframe, distinguishing between Low Time Frame <1h (LTF) and High Time Frame =/>1h (HTF) modes to optimize performance.
Enhanced Signal Clarity: Refined calculations reduce noise in lower timeframes and enhance trend detection in higher timeframes, offering clearer entry and exit signals.
Simplified Visualization: All critical information is consolidated into a single line, color-coded to indicate trend strength and direction, simplifying analysis without sacrificing depth.
Optimizations on LTF & HTF.
Adjustable Settings for Users.
Bug fix.
This Indicator is completed.
// © 2025 A0A. All Rights Reserved.
// This script is proprietary and protected under copyright law.
// Unauthorized copying, distribution, or use is strictly prohibited.
Visualizes the FOMO momentum oscillator as a candlestick chart.
Each candle represents the oscillator's open, high, low, and close values per bar, making trend shifts, momentum impulses, and reversals instantly visible.
Green candles indicate upward momentum, red candles indicate downward momentum.
No overlays, zones, or color filters—pure oscillator candles.
Skrip jemputan sahaja
Hanya pengguna disahkan oleh penulis boleh mengakses skrip ini. Anda perlu memohon dan mendapatkan kebenaran untuk menggunakannya. Keizinan selalunya diberikan selepas pembayaran. Untuk lebih butiran, ikuti arahan penulis di bawah atau hubungi A0A_Indicator secara terus.
TradingView TIDAK menyarankan pembayaran atau penggunaan skrip kecuali anda mempercayai sepenuhnya penulis dan memahami bagaimana ia berfungsi. Anda juga boleh menjumpai alternatif sumber terbuka dan percuma yang lain di dalam skrip komuniti kami.
Arahan penulis
Penafian
Skrip jemputan sahaja
Hanya pengguna disahkan oleh penulis boleh mengakses skrip ini. Anda perlu memohon dan mendapatkan kebenaran untuk menggunakannya. Keizinan selalunya diberikan selepas pembayaran. Untuk lebih butiran, ikuti arahan penulis di bawah atau hubungi A0A_Indicator secara terus.
TradingView TIDAK menyarankan pembayaran atau penggunaan skrip kecuali anda mempercayai sepenuhnya penulis dan memahami bagaimana ia berfungsi. Anda juga boleh menjumpai alternatif sumber terbuka dan percuma yang lain di dalam skrip komuniti kami.